Weather Services – Local Forecasts That Actually Mean Something
Brisbane apps are fine for the coast, but our valley plays by its own rules. Ridges, gullies and late arvo storms mean Dayboro needs a local-first approach. That’s why the Dayboro Weather Station collects, analyses and shares **our** conditions — so you can plan with confidence.
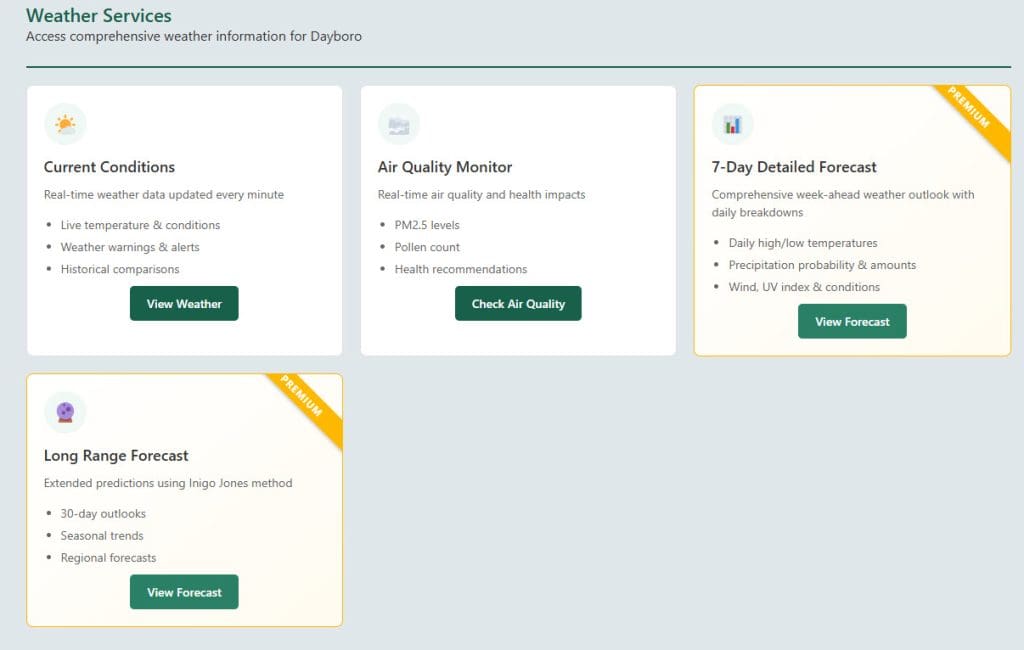
1) Current Conditions — Real Data, Right Now
The beating heart of the service. Calibrated local sensors push updates every minute so you see exactly what’s happening in Dayboro — not 30 km away. Values are archived and compared against long-term patterns so “today” is always in context.
What you get
- 🌡️ Live temperature & humidity with no rounding.
- 🌧️ Rainfall totals at 0.2 mm precision.
- 🌬️ Wind speed, gusts and direction in real time.
- 🌞 UV & solar radiation — handy for gardeners and roofers.
- ⚠️ BOM warnings mirrored to the page as soon as they’re issued.
- 📈 “How today compares” to typical values for this date.
Why locals use it
- Gardeners avoid over-watering by watching evaporation signals.
- Tradies time pours and paint with wind and humidity windows.
- Parents glance at UV and wind chill before weekend sport.
- Event organisers track showers and gusts in real time.
It’s practical weather, not just pretty icons.
2) Air Quality Monitor — Know What You’re Breathing
From spring pollen to dry-season smoke, air quality is the quiet part of weather that affects us all. Our URAD A4 monitor measures PM2.5 locally and blends in trusted pollen sources to give meaningful, health-first guidance for Dayboro’s microclimate.
What it tracks
- 🌬️ PM2.5 particulates (smoke & fine dust).
- 🌾 Pollen signal and seasonal allergens.
- ❤️ Simple health recommendations: open/close windows, mask, exercise timing.
Why it matters
Valley inversions trap smoke even when coastal readings look fine. Local numbers help people with asthma, hay fever and outdoor jobs choose the best parts of the day to be outside.
3) 7-Day Detailed Forecast — Plan Your Week Confidently *(Premium)*
The weekly view turns raw model output into Dayboro-specific guidance. We correct known coastal biases, add plain-English commentary, and highlight morning vs afternoon differences so you can line up work, sport, and garden tasks with fewer surprises.
What it offers
- 🌞 Daily highs/lows and “feels-like”.
- 🌧️ Rain probability with estimated amounts and timing windows.
- 🌬️ Wind direction & gust ranges; UV and comfort notes.
- 🕓 Clear morning/afternoon breakdowns for scheduling.
- 🗒️ Confidence flags when models disagree.
4) Long-Range Forecast — Planning Beyond the Week *(Premium)*
Inspired by Inigo Jones and modernised with satellite and station data, the long-range view looks to the next 30 days and seasonal tendencies. It’s not crystal-ball magic — it’s pattern literacy for real-world planning.
What it includes
- 📅 Rolling 30-day outlook updated weekly.
- 🌾 Seasonal moisture & evaporation balance signals.
- 🗺️ Regional context for Dayboro, Mount Mee, Samford and Pine Valley.
- 💧 Drought/rain rhythm tracking and easy-read narratives with confidence levels.
5) How These Layers Fit Together
Each layer builds on the last: now → this week → the month ahead. Here’s what’s free and what unlocks with a membership:
| Service | Update Frequency | Free | Weather Reports Members |
|---|---|---|---|
| Current Conditions | Every minute | ✅ | ✅ |
| Air Quality Monitor | Every 10 min | ✅ | ✅ |
| 7-Day Forecast | Daily | 🔒 | ✅ |
| Long-Range Forecast | Weekly | 🔒 | ✅ |
| Email Alerts & Reports | Custom | 🔒 | ✅ |
| Historical & Comparative Charts | Continuous | 🔒 | ✅ |
6) Behind the Scenes — Keeping It Accurate
In short: pro hardware, careful siting, smart software, and weekly verification.
- Hardware: Davis Vantage Pro2 with radiation shielding, backed by Ecowitt & URAD sensors.
- Processing: The Dayboro Weather Data plugin cleans noise and outputs neat JSON for dashboards.
- Sources: BOM warnings, lunar and satellite inputs, plus our station history.
- Verification: Forecasts are scored against reality (see Forecast Accuracy) and adjustments follow the data.
7) Real-World Use Cases
- Growers: time irrigation and cuts with long-range moisture signals.
- Tradies: line up roofing, pours and paint around wind/UV windows.
- Gardeners: avoid mildew and waste with evapotranspiration cues.
- Families: pick clean-air hours for outdoor play and laundry.
- Organisers: reduce cancellations by pairing 7-day with live conditions.
8) Local vs Generic Apps — Why It Feels Different
| Feature | Generic App | Dayboro.au Weather |
|---|---|---|
| Data source | City/coastal sensors | Local Dayboro station(s) |
| Update rate | 30–60 min | Every minute |
| Air quality | Regional averages | Local PM2.5 + pollen |
| Forecast coverage | Coastal bias | Valley & ridge aware |
| Long-range outlook | Rare | 30-day & seasonal signals |
| Accuracy tracking | Not published | Public scorecards |
| Privacy & ads | Ads/data sales | Ad-free, member-funded |
9) Email Reports & Custom Alerts *(Premium)*
Choose daily, weekly, or “only when it matters.” Reports include a quick current snapshot, confidence notes, and links to the detailed pages. Manage preferences anytime.
Configure Emails Manage Account
Ready to unlock the full Dayboro forecast suite?
Weather Reports membership is $3.95/month. It funds sensors, storage, and continuous improvements — and it pays you back in saved time, smarter watering and fewer ruined weekends.