
Dayboro Flood Outlook: El Niño, Viral Rain Maps and What the Evidence Says
Written 9 October 2026. Forecast details below are dated snapshots; check current warnings and forecasts before making weather-dependent decisions.
The flood posts have started doing the rounds. Big rain totals. Red and purple maps. A warning that 2027 could be Australia's wettest year since 1974.
A fair question has landed in my inbox: what does any of that actually mean for Dayboro?
I went through the maps, checked their dates and compared the claims with the Bureau's published outlook and local flood records. There is a wet signal worth watching. There is also a considerable gap between that signal and a forecast that our town will flood.
The El Niño story needs the same scrutiny. Turning a Pacific Ocean measurement into “Dayboro will be dry” skips the part that matters to people here: when the rain falls, where it falls and what our creeks do with it.
So I am applying the same test to both stories. Show me the dates, the measurements and the locality. A national headline will not tell us whether a local crossing is safe, whether the tanks will fill or whether a storm will miss our hill altogether.
This Dayboro flood outlook works through what we can establish, what remains uncertain and what would make me take the local risk more seriously.
The October flood posts: a signal worth watching, a conclusion worth checking
The Under The Weather Australia post circulating online describes a strengthening wet signal, possible flooding in Victoria and South Australia from the 10th, and flash-flood risk in parts of New South Wales and Queensland from mid-month. It stops short of promising exact local rainfall totals.
That last qualification matters. Unfortunately, readers can remember the dramatic flood language and miss the uncertainty attached to it.
The accompanying national rainfall maps show different weather models placing rain across different parts of Australia. Their common broad feature is the possibility of substantial rain somewhere in the east and south. Their differences are just as important: the heavier bands are not in precisely the same place, and southeast Queensland sits near sharp changes between wetter and drier colours in several panels.
For Dayboro, a shift of a rain band towards the coast, inland or offshore could make a large difference. A national map cannot tell a resident near a creek how much water will cross their access road.
It is reasonable to watch these developments. It is premature to translate them into a statement that massive floods are coming to our town.
Read the small print before reading the red colours
The four labelled maps are accumulated precipitation products. They add together predicted rain across their entire forecast periods. They do not display river height, property inundation, the probability of a flood, or necessarily the amount falling in one storm.
| Circulating map | Model | Approximate accumulation period |
|---|---|---|
| GFS map | GFS | 5–21 October, labelled 15 days |
| ACCESS-G map | ACCESS-G | 5–15 October, 10 days |
| ECMWF IFS map | ECMWF IFS | 5–20 October, 15 days |
| ECMWF AIFS map | ECMWF AIFS | 5–20 October, 15 days |
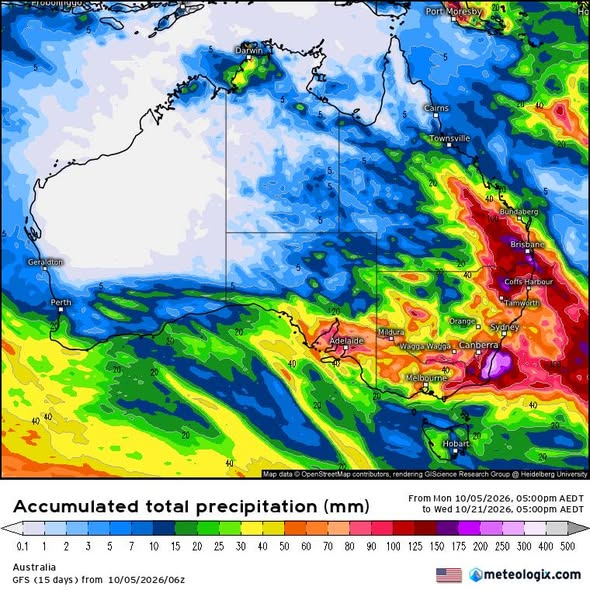
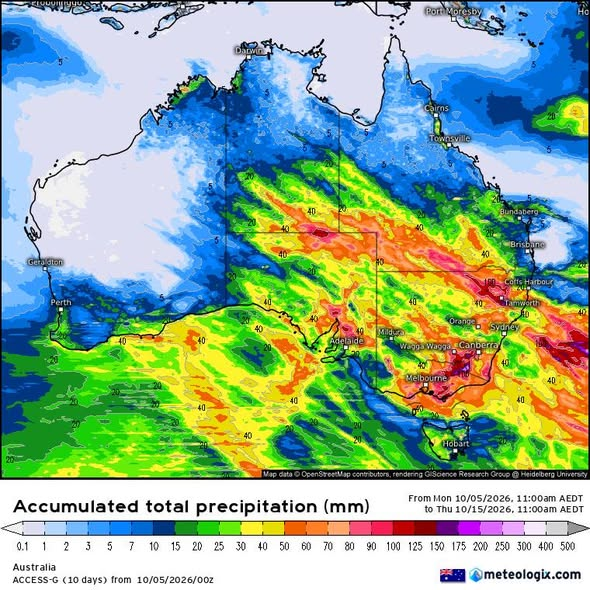
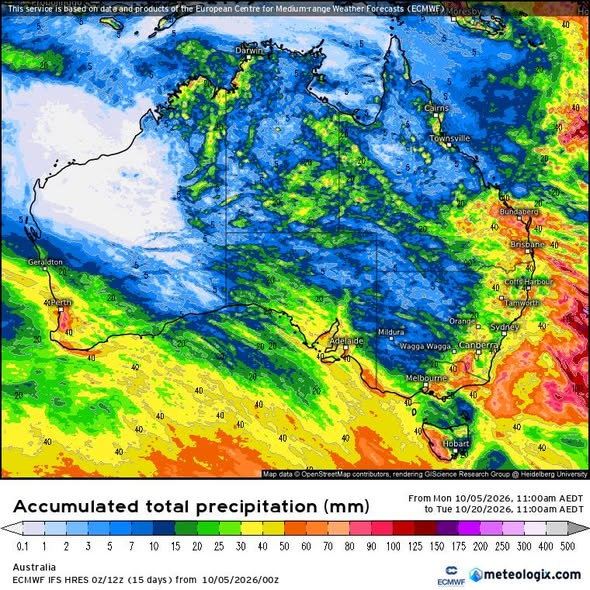
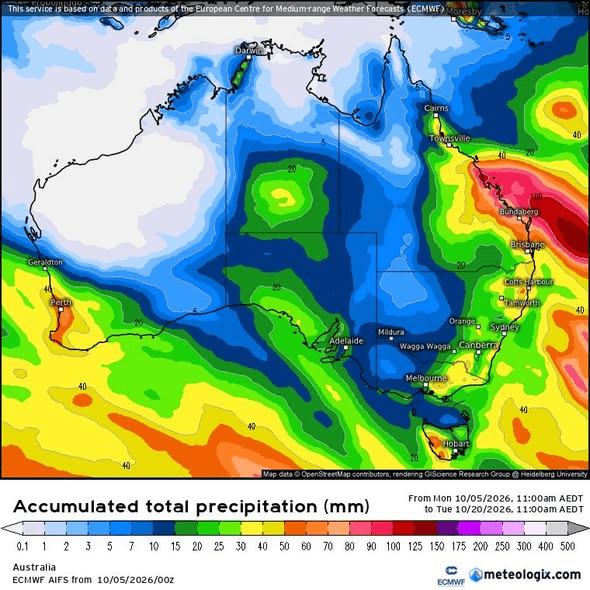
The captions use American-style dates: 10/05/2026 means 5 October. These particular runs are several days old at the time of writing. The GFS and other models also use different starting hours, so even matching dates does not make every accumulation interval identical.
Comparing ten days of rain with fifteen days is an uneven comparison. Extra days can add extra rainfall and deepen the colours without showing stronger agreement about the same event.
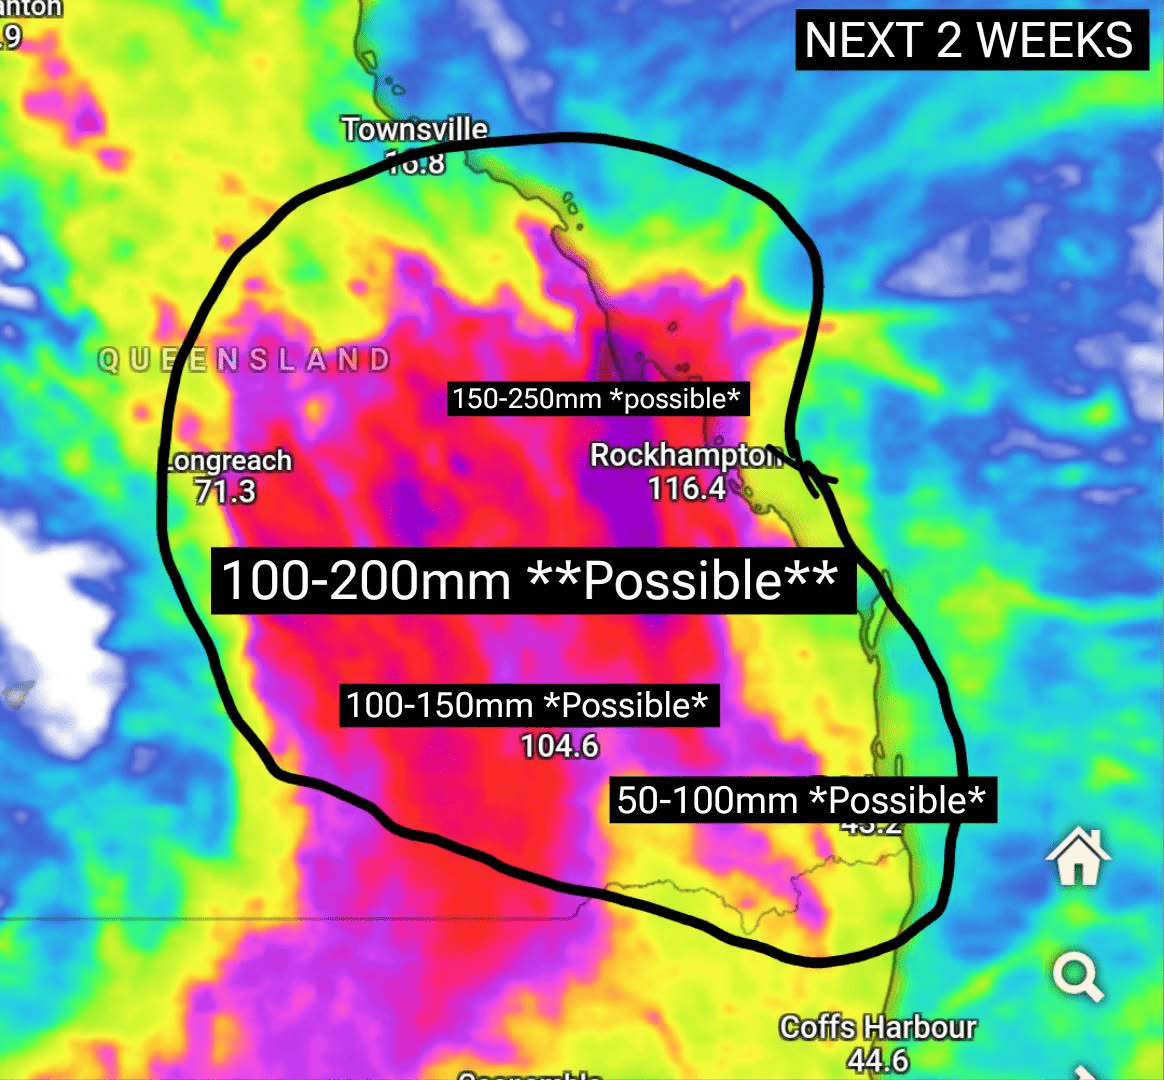
The annotated Queensland map is less transparent. Its full model label, issue time and original legend are missing. Hand-added ranges such as 100–200 mm “possible” are not independently calculated Dayboro probabilities. Nor is the printed value near Brisbane a measurement at our local station.
We should preserve those distinctions when sharing the pictures. A screenshot becomes less useful every time its date, legend or model name is cropped away.
“Storm season in overdrive”: does this new map establish that?
Another image doing the rounds declares “storm season kicks in overdrive next 2 weeks” and labels a large area of Queensland and northern New South Wales “50–150 mm likely”.
Look at the legend before accepting the headline. It says accumulated precipitation, measured in millimetres of rain. The image does not show the model name, run time or forecast start and finish dates. “Next two weeks” only has meaning when we know when the forecast was made.
The circled area reaches southeast Queensland, but Dayboro is not individually labelled. A broad coloured patch near Brisbane does not supply a dependable rainfall total for our town. The map also does not display thunderstorm frequency, hail, maximum wind gusts or flood probability. Its headline makes a claim about storm activity that the displayed rainfall variable alone cannot establish.
There is another step between a possible model total and “likely”. We need to know what probability supports that word and whether other forecasts agree over the same period. The screenshot provides neither calculation.
This is another reason to watch for rain, not independent confirmation of a Dayboro flood. It could even share a model or run with other circulating maps; without its provenance, counting it as an extra agreeing forecast would be guesswork.
Four models agreeing is useful, but how closely do they agree?
There are several levels of agreement. Models might agree that eastern Australia becomes unsettled while disagreeing about the particular state, catchment, day and rainfall intensity. That is much weaker evidence for a Dayboro flood than agreement on a concentrated rain event over our surrounding creeks.
The circulating pictures do not show how the same model changed through successive runs. They therefore cannot demonstrate the accompanying claim that the signal strengthens with every update.
They are also individual forecast outputs rather than a displayed distribution of possible outcomes. Ensemble forecasting explores uncertainty by running multiple forecasts with variations in starting conditions or model treatment. Its spread helps show whether an outcome is broadly supported or depends on a particular solution. That is more informative than treating one colourful map as a settled result. ECMWF's explanation of ensemble forecasting.
The practical test is straightforward: do later forecasts retain the same local wet area, shorten the timing window and increase agreement about intensity? Until then, “worth watching” is an honest description.
Putting the El Niño message in its proper place
Here is the criticism that stands up: reducing El Niño to “Australia will be dry” gives residents an incomplete picture. It confuses a seasonal influence with a local weather guarantee.
But it would be equally misleading to say the Bureau has been disproved merely because rain appears on an October map.
The Bureau's explanation updated on 28 September explicitly says that El Niño's strength does not translate directly into Australian impacts. It identifies other influences, including the Indian Ocean, nearby ocean temperatures and seasonal changes. It also says the year began with La Niña before transitioning to El Niño, and notes drier-than-average conditions in parts of southeast Queensland. Bureau: El Niño strength and Australian impacts.
Those qualifications belong in the public conversation as prominently as the dramatic climate label.
We can challenge exaggerated certainty without inventing a claim that the Bureau never made. We should also hold our own long-range predictions to the same standard: a proposed pattern needs a defined region, time period, outcome and record of how it performed.
Readers who followed our earlier El Niño assessment for Dayboro and check of the strongest-in-75-years headline should read them as dated assessments. This article adds a fresh check of the October flood claims; it does not assume every earlier projection remains current.
What the latest seasonal outlook actually adds
The Bureau's text outlook issued 8 October covers November to January. It favours above-average rain across parts of western and central Australia, extending into inland southern Queensland and northern New South Wales. It describes roughly even chances of above- or below-average rain across many other areas and says the Queensland/New South Wales wet signal is stronger later in the period than in November. Bureau long-range outlook, issued 8 October.
That national summary does not establish an exact probability for Dayboro. In particular, inland southern Queensland is not interchangeable with our coastal hinterland locality.
A seasonal outlook answers a question about accumulated conditions across months. An October rain map answers a question about a particular model's next ten or fifteen days. Neither can settle the other's question. A season can contain a damaging storm and still finish below its usual rainfall total; a wet season can deliver most of its rain without producing a record flood at a given gauge.
For residents, the sensible response is to keep the seasonal background in mind while updating short-term plans from local forecasts, observations and warnings.
The Google AI screenshot is not a rainfall ranking
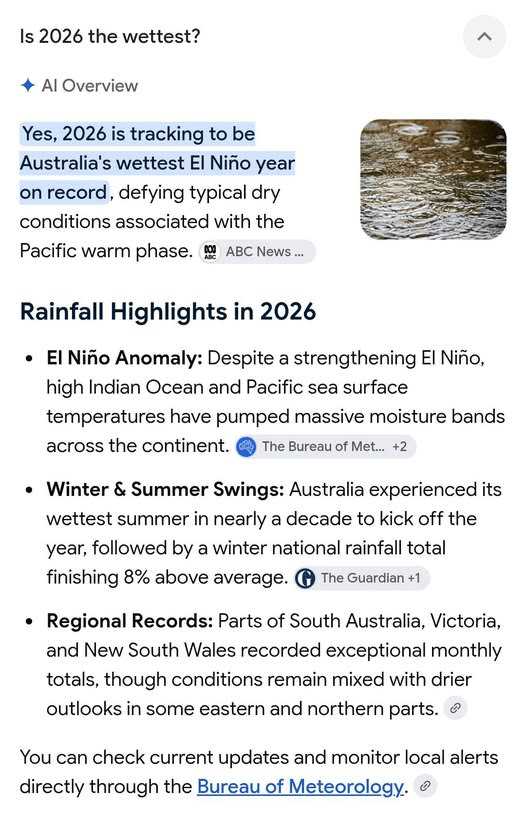
The AI Overview screenshot says 2026 is tracking towards Australia's wettest El Niño year. It mixes that assertion with statements about a wet summer, winter rainfall and regional records.
That is a collection of claims to check, not a dataset. Citation badges do not reveal, within the screenshot, the precise observation period, calculation or ranking behind the headline. We have not established the national year-to-date ranking from that image.
The wording also combines calendar-year rainfall with a climate state that changed during the year. Rain accumulated before an El Niño developed should not be presented as evidence that the later El Niño caused that rainfall.
A useful comparison needs a stated definition: all rainfall during a calendar year containing an El Niño, rainfall only during its active months, or rainfall during a particular season? Different definitions can produce different rankings. “Wettest El Niño year” and “wettest year overall” are different claims.
The same discipline applies locally. Nationally wet conditions do not prove that Dayboro has been wet, and an exceptional month elsewhere does not establish a record in our rain gauge.
Brisbane's flood graph is history, not a countdown
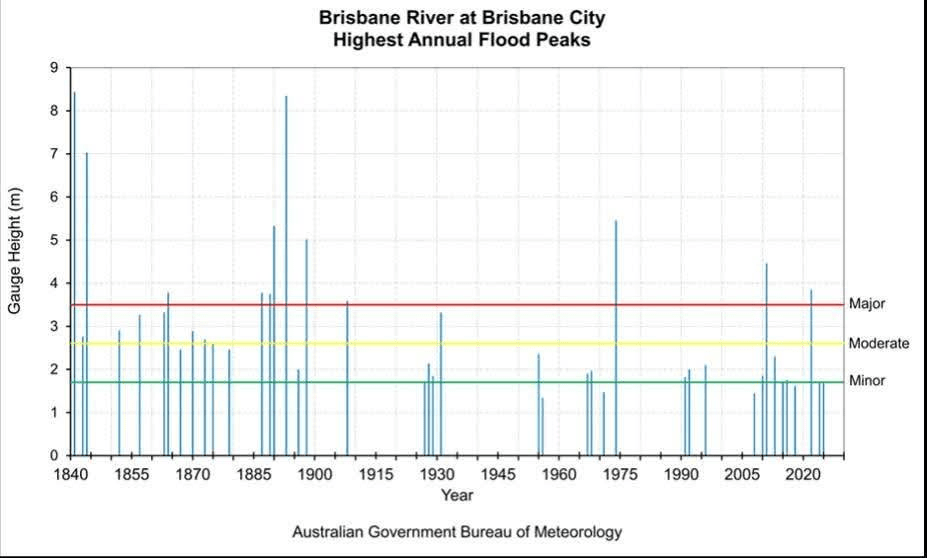
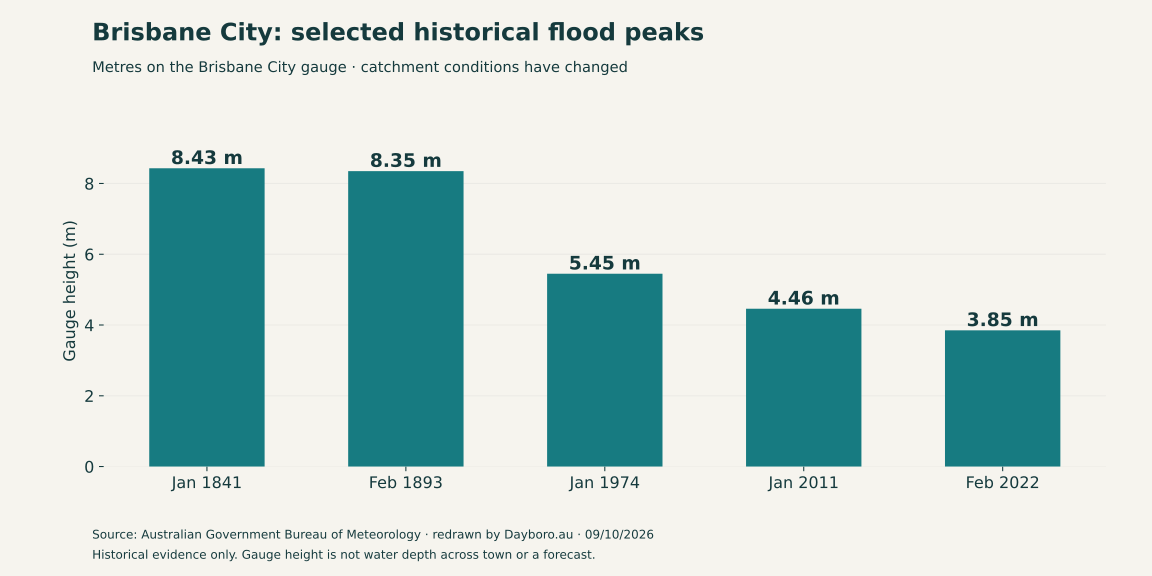
The Brisbane River graph being shared is a serious reminder that large floods have occurred. Selected Bureau figures include 8.43 metres in 1841, 8.35 metres in February 1893, 5.45 metres in January 1974, 4.46 metres in January 2011 and 3.85 metres in February 2022. The Bureau also notes substantial changes to the catchment, including dams and development. Bureau lower Brisbane River flood history.
Those numbers do not form a forecast for 2027. They do not establish a repeating interval, identify the next storm or reveal its rainfall footprint.
A gauge peak is the result of rainfall and the catchment's response. Comparing bars without considering changing river conditions can create a false impression of a simple repeating cycle.
The original graph also displays each year's highest peak. That presentation compresses multiple events in a year into one bar. A chart designed to summarise annual maxima cannot, by itself, establish how individual floods cluster within a season.
Most importantly for our readers, Brisbane City is a different monitoring location. Its gauge reading is not a measure of Terrors Creek or water depth on a Dayboro property.
Dayboro has its own flood history
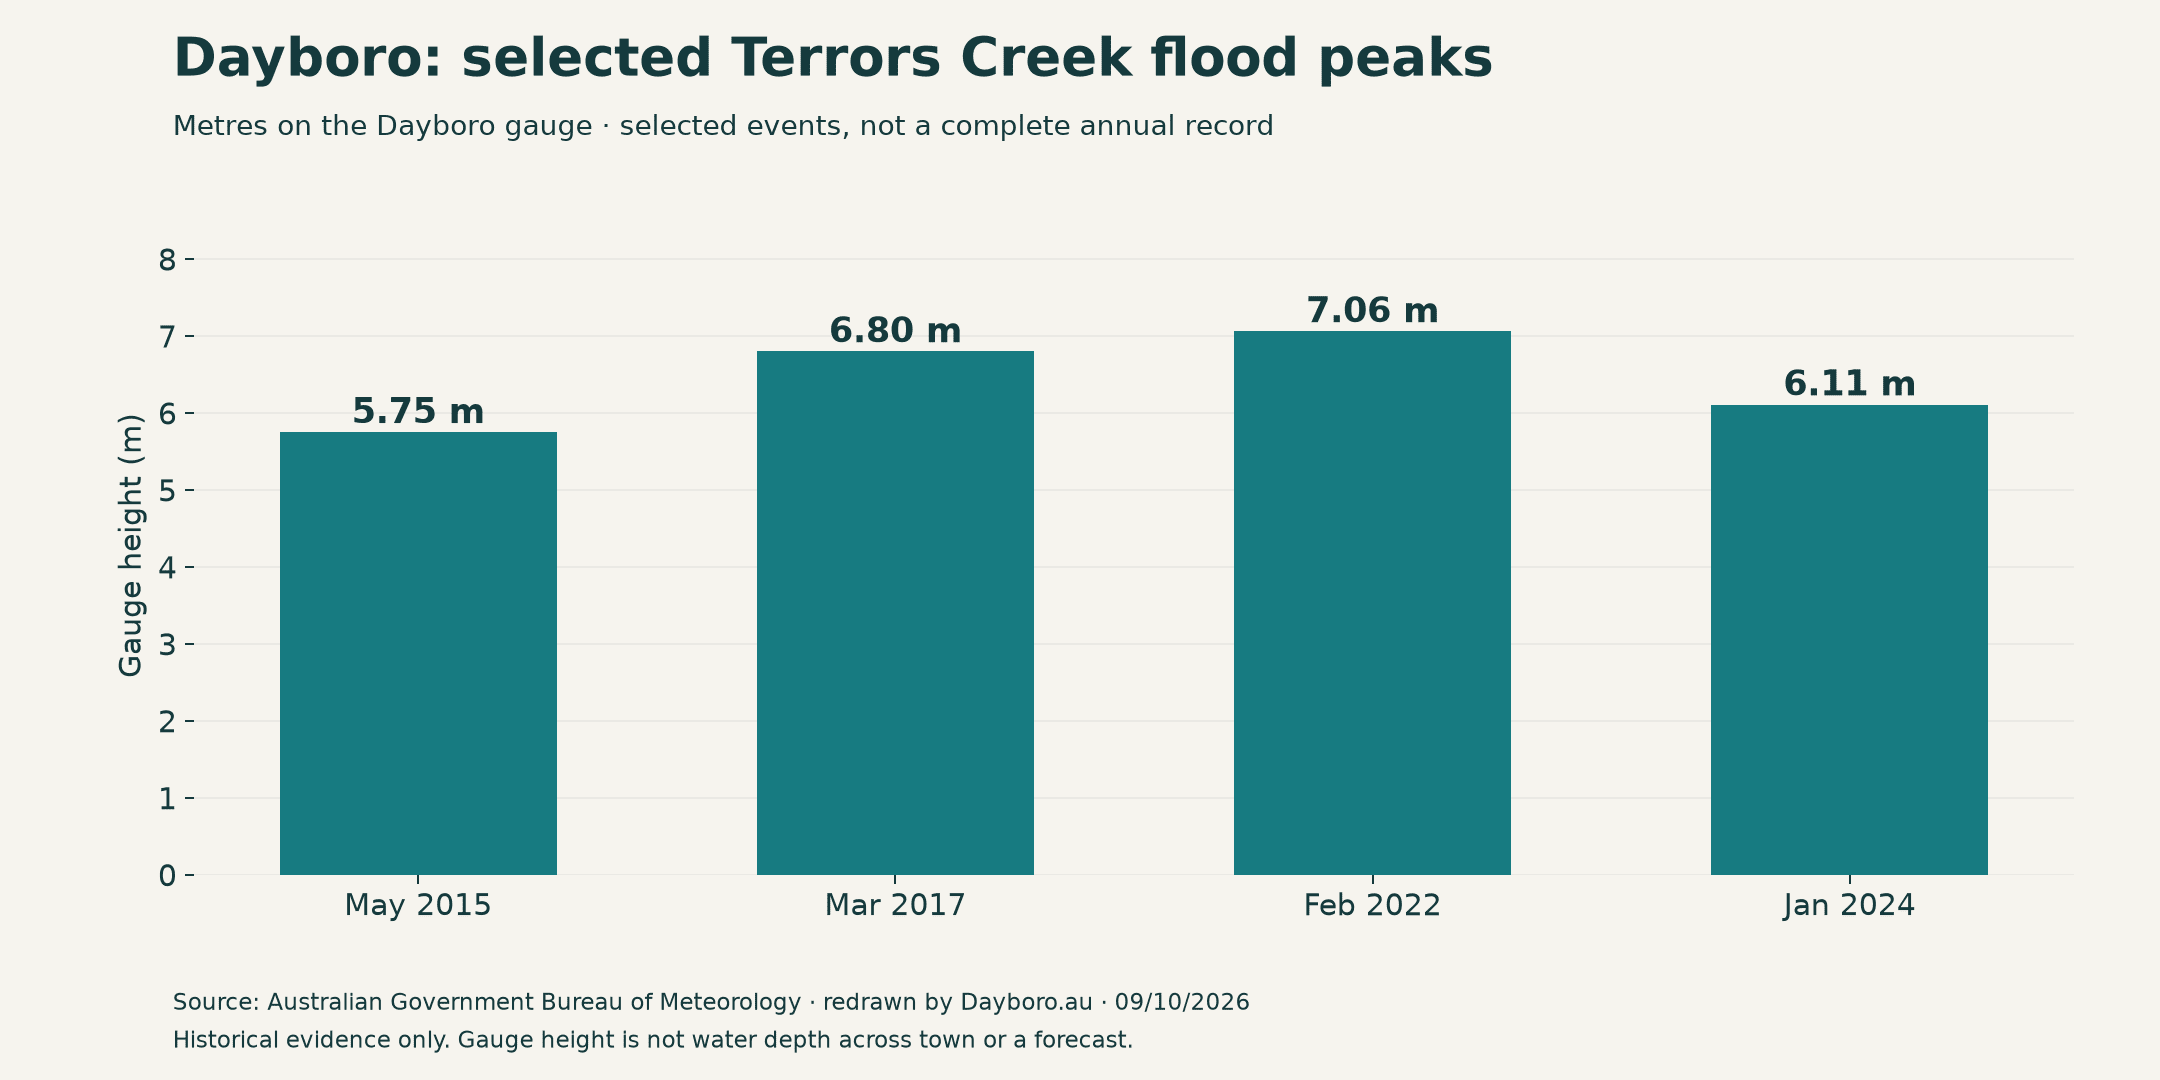
The Bureau's Pine/Caboolture brochure explicitly identifies Dayboro among communities affected by flash flooding in upper-catchment tributaries. Its selected Terrors Creek entries are 5.75 metres in May 2015, 6.80 metres in March 2017, 7.06 metres in February 2022 and 6.11 metres in January 2024. These are selected reported peaks, not a complete record. Bureau Pine/Caboolture flood information.
That is more directly relevant to our town than a national rainfall ranking. It confirms a real local hazard without making a prediction about the next flood.
Residents should ask about their own creek, access route and property setting. One address can remain dry while a nearby low crossing becomes impassable. Someone on higher ground may still lose safe access to work, school or livestock.
Historical knowledge is valuable here: note which routes were cut, which drainage paths carried water and where local observations were taken. Keep the event date attached to that knowledge. Do not assume that a house being dry in one event guarantees it will be dry in another with a different rainfall footprint.
The amount matters. The speed and location matter too.
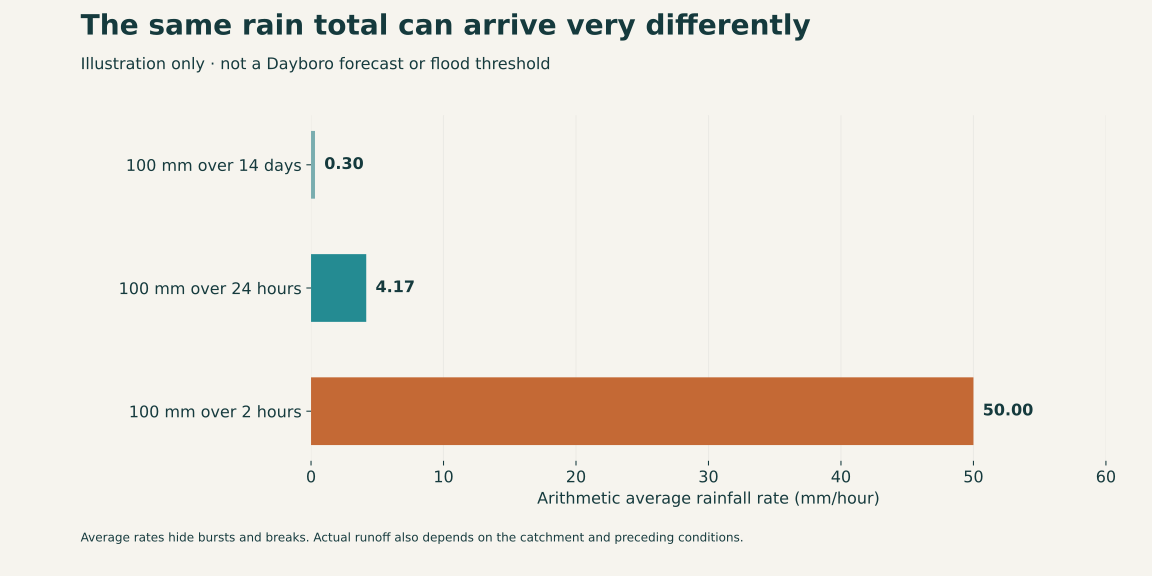
Imagine 100 mm falling over two weeks. Now imagine the same amount in two hours. The totals match, but the opportunity for rapid runoff is very different.
The diagram illustrates why a fortnight-total map is insufficient for a flash-flood claim. It deliberately does not assign a threshold at which Dayboro floods; that would require local hydrological evidence.
Flash floods can develop within hours of rain, including in small rural headwater creeks. The Bureau distinguishes these rapid events from slower river flooding and directs residents towards emergency-management and local-government information as well as weather warnings. Bureau explanation of flash flooding.
For a developing event, watch whether rain keeps passing over the same headwaters, whether earlier rain has already raised creek levels, and whether observations match the forecast. Rain at the town's gauge is useful, but it does not measure every part of the surrounding catchment.
There is no defensible shortcut from “red on the model map” to “a particular house will flood”.
What about the high-wind posts?
Rainfall accumulation maps do not show maximum wind gusts. The two Queensland panel sequences accompanying the posts appear to duplicate the same product. Their small arrows and coloured areas do not supply a readable, verified damaging-gust forecast for Dayboro.
That means the wind claim remains unsupported by these particular attachments. It does not mean wind damage is impossible.
A useful wind assessment needs a properly labelled gust product, a relevant forecast period and a locality. A rain band moving into southeast Queensland and a damaging gust reaching a particular street are separate predictions.
When sharing a wind claim, preserve the units. A speed in knots is different from the same number in kilometres per hour, and sustained wind is different from a brief gust. Missing that distinction can make an ordinary forecast sound much more alarming.
Could 2027 be Australia's wettest year since 1974?
It is possible for a future year to be exceptionally wet. The evidence attached to those posts does not establish that 2027 is likely to beat every national annual total since 1974.
The hurdle is substantial. The Bureau's 2011 annual summary reported approximately 705 mm of Australian mean rainfall and a record two-year total for 2010–2011. It gives genuine evidence of a sustained wet period associated with consecutive La Niña events. Bureau annual climate summary for 2011.
That historical example supports studying persistent climate conditions. It does not validate a specific ranking for 2027.
To turn the bold claim into a testable forecast, its author would need to define national area-averaged calendar-year rainfall, specify the comparison dataset and give a probability or numerical expectation. A Brisbane gauge chart cannot substitute for that calculation. Neither can an October 2026 fifteen-day rainfall map.
National rainfall and local flood severity also measure different things. Dayboro could experience a dangerous local event in a year that never challenges Australia's annual rainfall record. Preparedness should not depend on whether a national superlative eventually proves correct.
What might happen next around Dayboro and SEQ?
The Bureau Dayboro page retrieved for this article was issued at 9:03 am AEST on 8 October. It showed relatively small displayed rainfall ranges over the weekend, a regional thunderstorm mention, and higher rain chances for 13–14 October: 80% on both days, with displayed ranges of 0–15 mm and 0–10 mm respectively. These are dated forecast values, not absolute storm maximums or a current warning assessment. Bureau Dayboro forecast.
Together with the circulating model maps, that supports watching for a more unsettled period. It does not establish a major Dayboro flood event.
There are three useful possibilities to keep in mind. Rain bands may shift away and deliver modest local totals. Showers and storms may produce uneven rain, with some neighbourhoods receiving much more than others. Or forecasts may converge on concentrated heavy rain over local catchments, in which case the hazard assessment needs to change quickly.
Those are scenarios, not assigned probabilities. We will judge them by subsequent forecasts and measurements, rather than choosing the most dramatic image now and defending it later.
What residents can do now
Check gutters and accessible drains while conditions are safe. Think through alternative routes if a low crossing closes. Consider how animals, pumps and essential supplies would be managed if access were interrupted.
Use the Moreton Bay Disaster Dashboard for local alerts and road information, and the Bureau warning service for current weather warnings. Council's flood mapping information helps investigate property exposure; it is not a forecast of today's inundation. Never enter floodwater.
When a new screenshot arrives in a community group, ask for its model name, issue time, accumulation period and original link. When someone predicts a record, ask which record, where, over what period and with what confidence.
My position is straightforward. I am watching the wet signal, but I am not calling a record flood for Dayboro from these maps. I will change that assessment if the local evidence changes. Until then, keep an eye on the forecast, know your creek and your way home, and keep the dates attached to anything you share.

Get Dayboro weather delivered to your inbox every morning: forecasts, garden tips, and local updates. Subscribe free →