Cyclone Alfred Forecast.

How it unfolded from predicted through to the end.
The Impact of Ocean Temperatures and Cyclone Activity on Dayboro, Queensland

The Impact of Ocean Temperatures and Cyclone Activity on Dayboro, Queensland

  • 22 October, 2024

For Dayboro, the threat from cyclones might not come in the form of direct hits this year, but the effects of heavy rain, flooding, and strong winds around last week of Feb first week of March and should not be underestimated.

Read More
22 October, 2024
12 January, 2025
Flash Flooding Forecast next 90 days

Flash Flooding Forecast next 90 days

  • 12 January, 2025
Feb 22 – Mar 2HighCyclonic activity or monsoonal troughs could lead to widespread heavy rain and elevated flood risks.
Read More
Posted On Fakebook

Posted On Fakebook

  • 6 March, 2025

I posted about that cyclone Alfred as a cyclone would not drop more than 30mm if that. It is the lows that are the isse generaly and looking at the predictions done on fakebook. 
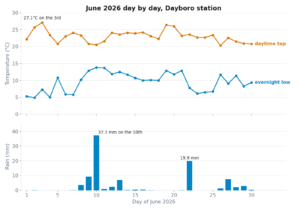
The numbers, I think, are rough...
  • Day 6 → 0.12 mm
  • Day 7 → 29.79 mm
    Turning in a low late Friday night.
  • Day 8 → 123.01 mm
  • Day 9 → 269.65 mm
  • Day 10 → 284.01 mm
  • Day 11 → 286.42 mm
  • Day 12 → 288.30 mm
  • Day 13 → 288.56 mm
  • Day 14 → 288.85 mm
  • Day 15 → 289.08 mm
Stay safe, and follow the directions from the authorities.
And show some numbers of rainfall when it is safe to do so.

It looked like the low will drop a lot of rain. 
Read More
6 March, 2025
12th March, 2025
Totals are close match to what we measured

Totals are close match to what we measured

  • 12th March, 2025

We lost power during the low, this low cause quite a bit more damage than initially thought. We had strong winds with a max of 50km/h measrued. 

Checking neighbouring stations the wind speed shows max 33km/h. 

Still a lot of damage to trees was done and some areas got more wind. 


Read More

What others measured

Dayboro has about 12 private weather stations that publish data at regular intervals. 

Below is a subset of their data, it shows the max wind gust of 56.8 km/h and the max rain of about 505.18 mm (which I question the setup on that one still it is what is measured). 


IDAYBO 2 Summary
March 1, 2025 – March 31, 2025

 HighLowAverage
Temperature32.8 °C16.4 °C23.4 °C
Dew Point23.8 °C16.2 °C20.6 °C
Humidity99 %47 %85 %
Precipitation388.90 mm
 HighLowAverage
Wind Speed26.3 km/h0.0 km/h2.5 km/h
Wind Gust42.1 km/h6.2 km/h
Wind DirectionWSW
Pressure1,012.60 hPa994.62 hPa

IDAYBO30 – Summary
March 1, 2025 – March 31, 2025

 HighLowAverage
Temperature32.4 °C22.1 °C
Dew Point25.2 °C18.3 °C
Humidity99 %73 %
Precipitation95.21 mm
 HighLowAverage
Wind Speed25.6 km/h0.0 km/h2.6 km/h
Wind Gust38.5 km/h3.8 km/h
Wind DirectionENE
Pressure1,014.80 hPa997.39 hPa

IDAYBORO3 – Summary
March 1, 2025 – March 31, 2025

 HighLowAverage
Temperature34.0 °C16.4 °C23.5 °C
Dew Point25.3 °C16.2 °C21.4 °C
Humidity99 %52 %89 %
Precipitation505.18 mm
 HighLowAverage
Wind Speed22.4 km/h0.0 km/h1.8 km/h
Wind Gust33.2 km/h2.7 km/h
Wind DirectionSE
Pressure1,020.12 hPa1,001.42 hPa

IDAYBO13 – Summary
March 1, 2025 – March 31, 2025

 HighLowAverage
Temperature34.0 °C16.1 °C23.8 °C
Dew Point23.9 °C15.8 °C20.7 °C
Humidity99 %45 %84 %
Precipitation446.79 mm
 HighLowAverage
Wind Speed38.1 km/h0.0 km/h4.4 km/h
Wind Gust56.8 km/h6.2 km/h
Wind DirectionSE
Pressure1,009.48 hPa990.86 hPa

IKINGS401 – Summary
March 1, 2025 – March 31, 2025

 HighLowAverage
Temperature31.3 °C17.2 °C23.7 °C
Dew Point23.0 °C16.9 °C20.0 °C
Humidity99 %47 %81 %
Precipitation98.33 mm
 HighLowAverage
Wind Speed27.7 km/h0.0 km/h4.8 km/h
Wind Gust43.9 km/h6.5 km/h
Wind DirectionWSW
Pressure1,015.71 hPa997.09 hPa

More Posts