
Autumn 2026: What We Actually Got
Winter is here now, so I can stop guessing and start counting. Autumn is done, the numbers are all in the database, and I can finally tell you what the valley actually did instead of what I thought it would do back in April.
The short version: autumn 2026 gave us 517.8mm of rain. That is almost exactly the 13 year average for this station, which is 528mm. So on the headline number, a completely ordinary autumn. But the way it arrived was not ordinary at all, and it made me look a bit silly. April basically forgot to rain. May then turned around and dumped nearly five months worth in thirty one days.
I watch this valley from Lyndhurst Hill, and I keep records, partly because I like to, and partly to keep myself honest. So let me hold myself to that. Back on 9 April I wrote an autumn outlook. The Bureau wrote one too, in late February. Now we get to mark both of them against reality.
The Three Months, One at a Time
Here is how each month landed against the long run average from my own station record.
| Month | Rain 2026 | 13yr average | Difference | Rain days |
|---|---|---|---|---|
| March | 251.9mm | 242.1mm | +4% | 11 |
| April | 45.4mm | 137.6mm | −67% | 9 |
| May | 220.5mm | 148.4mm | +49% | 15 |
| Autumn | 517.8mm | 528.0mm | −2% | 35 |
You can see the trap straight away. The autumn total is dead average, but no single month was average. March was bang on. April was 67% below. May was 49% above. The middle dropped out and the back end made up for it. If you only looked at the season total you would think nothing happened. Anyone who actually gardened through it knows different.
March: The Honest Month
March did what March usually does up here, which is rain hard early and then go quiet. We logged 251.9mm, near the long run average of 242mm. The wettest day was the 8th with 88.1mm, part of a rain band that parked over the range for the best part of three days. After that it dried off and gave us a 10°C overnight on the 28th, which was the coldest March night in our record bar 2008. I covered all that in the March review, so I will not chew it over again. March behaved. It was April and May that did the interesting stuff.
April: The Month That Quit
April 2026 produced 45.4mm. The average is 137.6mm. That is the driest April in my complete record bar one, and the exception, 2016, only managed 15.9mm in a freak year. Nine days had measurable rain but most were a millimetre or two of nothing. The first three weeks were genuinely bone dry. The month only scraped to 45mm because of a late wet patch from the 24th onward, which is the same trough that rolled into May and kept going.
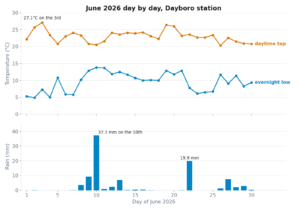
May: The Month That Paid It All Back
And then May. I did not see this one coming, and neither did the Bureau. May delivered 220.5mm against an average of 148mm, so half again as much as a normal May. It came in two big hits. The 18th dropped 66.5mm on its own. The 27th dropped another 56.6mm. Fifteen days of the month had measurable rain, which is a lot for what is meant to be the drying end of autumn.
To put it in context, a wet May is not unheard of here. May 2009 did 562mm, May 2022 did 304mm, May 2015 did 296mm. So 220mm is a wet May, clearly, but not a record. What made it notable was the timing. It landed right after the driest April we have had in nearly a decade, so the swing felt bigger than the raw number. The ground went from cracking to soaking in about three weeks.
How Autumn 2026 Sits Against History
Here is every complete autumn in my station record, sorted so you can see where 2026 fits.
| Year | March | April | May | Autumn total |
|---|---|---|---|---|
| 2009 | 102mm | 479mm | 562mm | 1,142mm |
| 2025 | 767mm | 246mm | 114mm | 1,127mm |
| 2010 | 603mm | 211mm | 91mm | 905mm |
| 2011 | 250mm | 248mm | 130mm | 628mm |
| 2021 | 262mm | 148mm | 118mm | 528mm |
| 2026 | 252mm | 45mm | 221mm | 518mm |
| 2022 | 117mm | 41mm | 304mm | 461mm |
| 2015 | 7mm | 146mm | 296mm | 448mm |
| 2024 | 236mm | 114mm | 66mm | 416mm |
| 2014 | 267mm | 43mm | 28mm | 338mm |
| 2023 | 156mm | 56mm | 117mm | 329mm |
| 2008 | 142mm | 26mm | 73mm | 240mm |
| 2020 | 156mm | 14mm | 14mm | 184mm |
| 2016 | 85mm | 16mm | 17mm | 118mm |
2026 sits sixth wettest of the fourteen autumns on record, right next to the 13 year average. Smack in the middle. The two monsters at the top, 2009 and 2025, are the kind of years that drag the average up and make a perfectly normal year like 2026 feel dry by comparison. It is not dry. It is normal. It just followed the wettest autumn we have ever recorded, so anything was going to feel like a let down after that.
The Temperatures: Warm, Then a Proper Step Down
On temperature the season behaved more predictably. Each month cooled off the one before, which is exactly what autumn is meant to do.
| Month | Avg max | Avg min | Hottest | Coldest |
|---|---|---|---|---|
| March | 30.0°C | 17.2°C | 35.4°C | 10.0°C |
| April | 28.7°C | 14.0°C | 35.0°C | 10.0°C |
| May | 25.1°C | 13.4°C | 29.8°C | 7.1°C |
The thing that stands out to me is how stubborn the warmth was. April still hit 35.0°C on one day, which is a summer number on the wrong side of the calendar. We did not get a properly cold night until 8 May, when it dropped to 7.1°C, the coldest of the whole season. After that the warm afternoons gave up and May settled into normal late autumn weather. Warmer than average days, which is what the Bureau called, were definitely the pattern. I had my doubts about that in April when it would not cool down, but it held true.
Marking My Own Homework
This is the part I do not get to skip. On 9 April I put numbers on the table. Here is how they did.
I forecast April
I forecast May
So I got both months wrong, in opposite directions. I had April too wet and May too dry. My estimated autumn total was around 460 to 470mm. The actual was 518mm. That is within about 11% on the season total, which sounds alright until you remember it was two big errors that happened to partly cancel out. That is not skill. That is luck doing me a favour.
Where did I go wrong. I leaned on the positive Indian Ocean Dipole signal that was showing in early April, and on the dry start, and I talked myself into a drying finish to the season. The classic mistake. I let what was happening in front of me set the whole forecast. The IOD did suppress April, indeed it did, but it had no grip on May at all, and a run of coastal troughs late in the season did exactly what I said they might do and then some. I even wrote at the time that local dynamics and coastal troughs can override the IOD. I just did not believe my own caveat enough to back it.
The honest scorecard
Autumn total: close. Forecast around 465mm, actual 518mm. Within 11%.
Monthly split: wrong both times. April far too wet, May far too dry. The two errors cancelled, which is why the total looks better than the forecast deserved.
Temperature: the warm days call was right. The cooling did arrive, a bit later than I expected, around the 8 May cold snap rather than mid April.
Lesson for me: stop letting the current dry spell write the rest of the season. A positive IOD tilts the odds, it does not hand you the result.
What the Bureau Said, and How It Did
The Bureau of Meteorology issued its autumn long range forecast in late February. For our part of the world the Bureau played it cautious, and on the whole that caution paid off better than my confidence did.
On the climate drivers, the Bureau had the 2025 to 2026 La Niña weakening back to neutral through early autumn, with a neutral Indian Ocean Dipole. That is more or less how it ran. On rainfall, the Bureau gave no strong wet or dry signal for most of Queensland, with only a slightly raised chance of below average totals around the Darling Downs and Granite Belt, well to our south and west. For our region they essentially said it could go either way.
For an average autumn that landed within 2% of normal, no strong signal was the right call. It is not an exciting forecast, but it did not get burned the way a confident dry call would have. On temperature the Bureau leaned warm for days and nights across the southern half of Queensland, and that verified well. April refused to cool down, May still ran warm in the afternoons, and the overnight averages sat on the warm side of normal until the May change.
What It Meant for the Garden
For anyone growing food, this was a season of two completely different jobs. Through April the soil was warm but dry. My station had soil temperature at 10cm averaging 22.5°C in April, plenty warm for cool season crops to get going, but with no rain to back it you were watering every second day or watching seedlings sulk. By May the problem flipped. The soil cooled to an average of 20.3°C, growth slowed the way it always does at this time, and then 220mm of rain meant the issue was drainage and fungal pressure, not drought.
If you got your brassicas and leafy greens in during that early April window and kept the water up, May rewarded you. If you waited for rain before planting, May caught you starting late into cooling soil, which is a harder ask. This is exactly the kind of timing call where a generic planting calendar lets you down. A calendar written for the average autumn would have told you to expect rain in April. There was none. The station knew. The calendar did not.
Garden Buddy reads the actual station weather every morning, not an average from a wall chart. It would have told you the soil was warm but bone dry in April, and to keep watering. Personalised to your patch, backed by the data on the hill.
Try Garden BuddyThe Bottom Line
Autumn 2026 was an average season that did not feel average for one day of it. The total, 518mm, sits right on the 13 year mean. But it got there the hard way, with the driest April in years bolted onto a May that rained half again as much as it should. March behaved. April quit. May paid the debt back with interest.
I called it wrong on the monthly split and got bailed out by two errors cancelling. The Bureau hedged and came out clean. The honest read of this autumn is that the signal was weak, and when the signal is weak you do not get to be confident. I will wear that one. You keep records so that next time the dry spell starts whispering "this is a dry year", you have got 2026 sitting there to remind you that May does not always agree.
Winter is here now. Whether it stays as obliging as the back half of autumn, well, I will write that one up in three months and we can mark it together.
Data Sources & Methodology
Station data: Dayboro Weather Station, Lyndhurst Hill (27.18°S, 152.83°E, 72m elevation). Ecowitt GW2000 with WS90 sensor suite, logged to WeeWX and MariaDB at a 5 minute interval. All 2026 autumn figures are measured daily totals and daily temperature extremes from the station archive.
Historical comparison: 14 complete autumn periods (March to May) drawn from the station archive: 2008–2011, 2014–2016, 2020–2026. Long run averages quoted here are the mean of the 13 complete years before 2026. Average autumn total 528.0mm, average March 242.1mm, average April 137.6mm, average May 148.4mm. Years with incomplete or missing daily records were excluded.
Dayboro outlook: the 9 April 2026 autumn outlook combined the Inigo Jones analogue pipeline and the Dayboro Model (WXSIM, calibrated for the local microclimate). Verified here against measured station data.
BOM outlook: Bureau of Meteorology long range forecast for autumn (March to May) 2026, issued late February 2026. ENSO returning to neutral from a weakening La Niña, neutral IOD, no strong rainfall signal for most of Queensland, warmer days and nights likely for the southern half of the state. Source: bom.gov.au climate outlooks.
Figures are from the Dayboro Weather Station unless noted. Your own property may differ from the station. Elevation, aspect and distance from the range all matter up here.
Get Dayboro weather delivered to your inbox every morning — forecasts, garden tips, and local updates. Subscribe free →