How Accurate are the forecasts?
There is a belief system that if it is not from the BOM (Australian Bureau of Meteorology), the forecast cannot be accurate. If you do not have completed 6-9 yrs of university degree you simply cannot know about the weather.
Then add to that that you disagree with the current Climate Change narrative that all this climate change is man-made and has never happened before. You are a sure thing for criticism, reticulation and all sorts of things considered the “new normal”.
What they forget.
Weather forecasting, medium and long-term, is not new. It was done centuries before the BOM et al. It is not rocket science it is tricky at best, but it always follows the same patterns. That we have not records old enough to clearly define those patterns for commercial use, well that is another thing.
Having a family farming background, my grandparents always had an idea of what the weather would be like weeks in advance simply because they listened to nature and could read the land. They did not need computer models or other weird stuff.
The challenge.
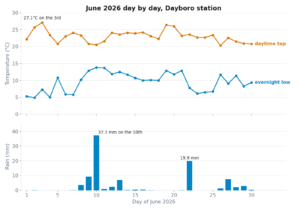
So, I figured out how accurate the Dayboro.au forecasts are versus the BOM forecasts; it is time to put some numbers up so the critics can see what is what. Perhaps they are right… time will tell.
So far the analysis indicates that Dayboro’s forecasts for temperatures, both high and low, are notably more accurate than those provided by BOM, consistently aligning closely with actual observed conditions. In contrast, Dayboro tends to significantly overestimate rainfall, particularly during extreme weather events, making BOM’s rainfall forecasts comparatively more reliable and realistic.
Thus, for precise temperature predictions, Dayboro’s forecasts are preferable, whereas for rainfall expectations, BOM forecasts should be favored.
How Weather Accuracy Statistics Are Calculated
Here’s an explanation of how the numbers and statistics in the Weather Accuracy System are calculated, including the formulas used.
Basic Difference Calculation
The foundation of the accuracy assessment is calculating the difference between forecast values and actual measurements.
For example, with temperature:
Temperature_difference = Actual_temperature - Forecast_temperature
This is done for multiple weather metrics:
- High temperature
- Low temperature
- Average temperature (derived from high and low)
- Wind speed
- Maximum gust
- Precipitation
- Relative humidity (when available)
- UV index (when available)
Accuracy Percentage Calculation
Raw differences are converted to accuracy percentages using this formula:
Accuracy_percentage = (1 - (|difference| / max_tolerable)) × 100%
Where:
differenceis the absolute value of the differencemax_tolerableis set to 5.0 for all metrics, representing the maximum acceptable difference- If
differenceexceedsmax_tolerable, accuracy is set to 0%
There are a few ways you can calculate the percentage. We use the same method for both, and we use.
Daily Accuracy Calculation First:
The second script calculates accuracy percentages for each day individually, based on that day’s difference. Each day has an accuracy percentage (0–100%).Monthly Aggregation:
The script calculates monthly accuracy by averaging daily accuracy percentages directly (not the differences). This means an outlier day only impacts the accuracy for that single day, not skewing the entire month as dramatically.
This approach is generally more representative of actual forecast accuracy. Instead of calculated once per month on the average difference for the month.
In code, this is implemented as:
This creates a linear scale where:
- Perfect prediction (difference = 0) yields 100% accuracy
- Small differences (under 1) yield high accuracy (>80%)
- Moderate differences (2-4) yield medium accuracy (20-60%)
- Large differences (≥5) yield 0% accuracy
Daily to Monthly Aggregation
For monthly views, daily differences are averaged:
					function weather_accuracy_difference_to_accuracy($diff) {
    $abs_diff = abs(floatval($diff));
    $max_tolerable = 5.0;
    if ($abs_diff >= $max_tolerable) {
        return 0;
    }
    return round((1 - ($abs_diff / $max_tolerable)) * 100);
}
					Monthly_average_difference = Sum_of_daily_differences / Number_of_days

Monthly_accuracy = weather_accuracy_difference_to_accuracy(Monthly_average_difference)
Overall Accuracy Calculation
The “Overall Accuracy” for a month combines all available metrics:
Overall_accuracy = (Temperature_acc + Hi_Temp_acc + Low_Temp_acc + Wind_Spd_acc + TotPrcp_acc + Max_Gust_acc + RelHum_acc + UV_Index_acc) / Number_of_metrics
Seasonal Averages
Seasonal averages group months by season and average their overall accuracy scores:
Season_accuracy = Sum_of_monthly_overall_accuracies / Number_of_months
For the Southern Hemisphere:
- Summer: December, January, February
- Autumn: March, April, May
- Winter: June, July, August
- Spring: September, October, November
Year-over-Year Trends
These calculate how accuracy has changed between years:
Year_trend = Current_year_accuracy - Previous_year_accuracy
A positive trend shows improvement, while a negative trend indicates declining accuracy.
Colour Coding
Difference values are color-coded for visual assessment:
- Green: |difference| ≤ 2 (small differences)
- Orange: 2 < |difference| ≤ 4 (moderate differences)
- Red: |difference| > 4 (large differences)
Best/Worst Performance
These statistics identify the months with the highest and lowest overall accuracy scores, helping to identify patterns in forecast performance.
Get Dayboro weather delivered to your inbox every morning — forecasts, garden tips, and local updates. Subscribe free →