
The Quiet Revision: How Climate Scientists Removed Their Most Cited Scenario, and What It Reveals About Scientific Consensus
Abstract
On 7 April 2026, the Coupled Model Intercomparison Project published its new scenario framework in Geoscientific Model Development. Lead author Detlef van Vuuren and a large international team applied one word to the scenario that has underpinned worst case climate projections for the past decade: implausible. That scenario, SSP5-8.5, projected 4.4 degrees Celsius warming by 2100 and found its way into central bank stress tests, national climate assessments, and thousands of peer reviewed impact studies. This paper examines three questions. Does the CMIP7 revision change what scientists know about the cause of observed warming? No. Does it change what we know about likely future warming? Significantly. Does it invalidate the "97% of scientists agree" claim? That depends entirely on what you think the claim was measuring. The three major studies behind that headline each measured one specific thing: whether peer reviewed climate scientists accept that human activity has caused observed warming since approximately 1850. They did not measure future projections, plausible scenarios, or expected consequences. The CMIP7 revision does not directly challenge the attribution studies. What it formally removes is Layer 3, the business as usual framing that was never the attribution consensus in the first place. Whether Layer 1 itself is as settled as the 97% headline implies is a separate question, one the pre-industrial temperature record, satellite observations, and low-sensitivity analyses each raise on their own terms.
1. A Publication That Went Largely Unnoticed
The World Climate Research Programme endorsed the new CMIP7 scenario framework on 19 February 2025. The final peer reviewed paper, led by Detlef van Vuuren of PBL Netherlands Environmental Assessment Agency, appeared in Geoscientific Model Development on 7 April 2026. It was designated a WCRP Highlight paper, a designation reserved for work the programme considers significant for the broader science community.
There was no press conference. No IPCC announcement. No coverage in the mainstream climate press, as far as any record shows. Sceptical media picked it up within days. The publications and institutions that had built their risk frameworks on SSP5-8.5 said nothing.
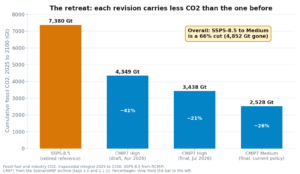
The paper used one word about SSP5-8.5, the scenario that projected roughly 128 gigatons of carbon dioxide equivalent per year by 2100 and warming of 4.4 degrees Celsius. That word was implausible.
In a scientific document, words are chosen with care. Implausible is not a mild qualification. It is not "at the high end of the uncertainty range" or "less likely in current trends." It is a statement that this trajectory falls outside the range of credible futures. The researchers who built and maintained the scenarios that shaped global climate policy for a decade have now formally removed the one that underpinned the worst case.
The silence that followed that removal is as interesting as the removal itself.
2. What the CMIP7 Paper Actually Says
Van Vuuren et al. (2026) give the reasoning without hedging. SSP5-8.5 required a roughly fivefold increase in coal consumption by 2100 relative to today. It assumed the world ignored the substantial cost reductions in renewable energy that have occurred since the scenario was constructed, made no meaningful climate policy, and expanded fossil fuels along a trajectory that had, by 2026, become clearly detached from real world trends in energy systems.
The new CMIP7 HIGH scenario reaches approximately 71 gigatons of carbon dioxide equivalent per year by 2100. SSP5-8.5 reached 128 gigatons. The associated temperature projection for the new HIGH is approximately 3.0 degrees, not 4.4.
The paper states directly:
"the CMIP6 high emission levels (quantified by SSP5-8.5) have become implausible, based on trends in the costs of renewables, the emergence of climate policy and recent emission trends."
And elsewhere:
"Clearly, this scenario is not a 'business-as-usual' scenario nor the no-policy reference scenario for the other scenarios."
Well, that second statement is the one with the greatest implications for public understanding. For years SSP5-8.5 was presented in media coverage, government reports, and academic impact studies as the trajectory the world is on if nothing changes. That characterisation underpinned the framing of climate risk as existential and urgent. The scenario architects themselves now state it was never that.
The new CMIP7 MEDIUM scenario runs warmer than current policy trajectories after 2050. It is better understood as policy stagnation than current policy. The new HIGH borrows SSP3's demographic assumptions, placing global population at 14.5 billion by 2100 (KC et al., 2024, IIASA WP-24-003). That figure is well above most central demographic projections, which anticipate population peak this century followed by decline. The new HIGH is a plausible scenario in the sense that CMIP7 endorses it. It is still not a prediction.
A 3.0 degree HIGH scenario is serious. The point is not that climate risk has disappeared. The point is that the specific risk calculation built on an implausible pathway needs to be reassigned to a plausible one.
3. Where SSP5-8.5 Came From and How It Spread
The lineage begins with RCP8.5, introduced in IPCC AR5 in 2013. That scenario required coal consumption to increase roughly fivefold by 2100 relative to 2000 levels. It was constructed as a worst case boundary condition for emissions modelling, not as a forecast of the most likely outcome.
In IPCC AR6, published in 2021, RCP8.5 was carried forward as SSP5-8.5. Importantly, IPCC AR6 Working Group I Summary for Policymakers includes a footnote that reads: "the feasibility or likelihood of individual scenarios are not part of the assessment." The IPCC itself explicitly deferred the plausibility question. CMIP7 has now answered it.
In the years between AR5 and CMIP7, SSP5-8.5 spread into policy and finance at scale:
- The US National Climate Assessment fifth edition (NCA5) uses SSP5-8.5 for its impact projections.
- Australia's Climate Change in Australia national projections are based on SSP5-8.5.
- The Network for Greening the Financial System Hot House World scenario, used by more than 140 central banks for climate financial stress testing, was calibrated to RCP8.5.
- The World Bank Climate Knowledge Portal defaults to SSP5-8.5 and SSP3-7.0.
This is insted not a story about bad faith. SSP5-8.5 was a legitimate tool for exploring tail risk in climate projections. The problem arose when it was adopted as a baseline rather than as a boundary condition. Hausfather and Peters (2020), writing in Nature, warned that RCP8.5 was being systematically misused as a "business as usual" scenario across research and public communication. That warning came five years before CMIP7 formalised the same conclusion.
Pielke and Ritchie (2021) documented more than 8,500 academic papers published between January 2020 and mid-June 2021 that used implausible emission scenarios as their baseline. The impact projections that followed, covering heat deaths, population displacement, agricultural loss, and sea level rise, typically did not state that they assumed a scenario the scenario architects would later label implausible. The numbers were presented as projections of what would happen, not as explorations of a specific boundary condition.
4. What "97% of Scientists Agree" Actually Measures
The consensus claim comes from three widely cited studies. Understanding what each actually measured is essential to understanding why CMIP7 does not invalidate the consensus, and equally why the consensus does not validate the projections that were built on SSP5-8.5.
Cook et al. (2013) analysed 11,944 peer reviewed abstracts on climate science published between 1991 and 2011. Of those, 66.4% expressed no position on the cause of observed warming. Among the 33.6% that did express a position, 97.1% endorsed the view that human activities have caused some degree of warming. The "97%" headline comes from this subset. Only 64 papers out of the full 11,944, roughly 0.5%, explicitly stated that human activities are the dominant cause of observed warming.
Lynas, Houlton and Perry (2021) examined approximately 3,000 papers on climate science and found only four that disputed the basic attribution claim. Powell (2019) reviewed 11,602 papers and found zero explicit rejections of human caused global warming.
The methodology behind all three studies has attracted documented peer reviewed criticism. Cook et al. (2013) classified papers from abstract text alone, without reading full papers. The study also invited paper authors to self-rate their own work. Those self-ratings produced a meaningfully lower endorsement rate than the abstract-rater classifications, an internal inconsistency Cook et al. did not resolve (Cook et al., 2013, supplementary data). Tol's reanalysis (Tol, 2014) found duplicate entries, inconsistent classifications, and noted that many of the 11,944 included papers were not primarily about the attribution question at all: economic analyses, impact studies, and papers from adjacent fields that simply assumed human causation as background context and were classified as endorsing it. Powell's (2019) method treated the absence of explicit rejection as endorsement. A paper that does not address the attribution question is not the same as a paper that tests and confirms it. Absence of rejection is not confirmation.
All three studies measure the same narrow question: do peer reviewed climate scientists accept that human activity has caused some or most of the observed warming since approximately 1850? That is Layer 1 attribution science. It is well supported and is not disputed here.
None of these studies measure:
- How much warming will occur by 2100
- Whether any particular emissions scenario is plausible
- Whether the expected consequences will be dangerous
- Whether SSP5-8.5 represents a credible future
The American Meteorological Society surveyed its own membership in 2012, with roughly 1,800 respondents. Only 52% said they believed recent warming was "mostly" attributable to human activity. Among specialists, even the narrow attribution question was more contested than the 97% headline suggested.
What the satellite record and pre-industrial temperatures show
The attribution studies measure whether scientists accept some human influence. They do not measure how much. That is a different question, and one the evidence handles with considerably less certainty.
Spencer and Christy's UAH satellite temperature dataset, which has provided direct tropospheric temperature measurements since 1979, consistently shows warming at rates below surface-based datasets and well below most IPCC-aligned model projections. Spencer's peer reviewed analysis of Earth's radiant energy balance (Spencer & Braswell, 2011) yields an equilibrium climate sensitivity estimate near 1.2°C per doubling of CO2. The IPCC AR6 central estimate is 3.0°C. At 1.2°C sensitivity, the observed warming since pre-industrial times does not require human CO2 emissions to be the dominant cause. Natural variability, solar forcing, and ocean heat redistribution account for a substantial part, possibly most, of the measured trend.
The pre-industrial temperature record makes the dominance claim harder to sustain. Greenland GISP2 ice core data (Alley, 2000; Stuiver & Grootes, 2000) clearly resolves the Medieval Warm Period, the Roman Warm Period, the Dark Ages cooling, and the Holocene Climate Optimum. The Holocene Optimum, roughly 4,000 to 8,000 years ago, shows higher temperatures across many high latitude regions than the present day, with atmospheric CO2 at pre-industrial levels throughout. Northern Hemisphere temperature reconstructions covering the past two thousand years (Ljungqvist, 2010) place the Medieval Warm Period at temperatures comparable to recent decades in many records. The current warming trend, real and measured as it is, does not appear unusual within the context of natural Holocene variability. That does not mean human emissions have contributed nothing. It means the claim that they are the dominant cause, and that current temperatures are unprecedented, is not supported by the full record.
The IPCC AR6 WGI Summary for Policymakers is itself structured in two halves that make this separation clear. Section A covers the current state of the climate system and attribution of observed changes: high confidence, multiple independent lines of evidence. Section B covers possible futures under different scenarios: explicitly conditional on pathway, explicitly not a consensus forecast. The two halves rest on different evidence bases. Eventually conflating them has been the source of much of the public confusion.
The three-layer structure:
Layer 1: Human CO2 emissions have contributed some observed warming since approximately 1850. This is the narrow question the attribution studies measure. How much that contribution is, relative to natural variability, remains scientifically contested. Spencer and Christy's satellite record and low-sensitivity analyses suggest the human share may be considerably smaller than the IPCC central estimate assumes. The pre-industrial Holocene record shows comparable warming cycles with no industrial forcing at all. The CMIP7 revision does not directly affect the attribution studies, but those studies never measured what the 97% headline claimed they measured.
Layer 2: Future warming will reach X degrees by 2100. Scenario-conditional projections. Not a consensus claim. Changed significantly by CMIP7.
Layer 3: Business as usual leads to 4.4 degrees by 2100. Built on SSP5-8.5 as a no-policy baseline. Formally displaced by CMIP7. The researchers themselves have stated this was never a business as usual scenario.
Building on authority of attribution science to validate Layer 3 claims has been the structural problem in climate communication for over a decade. The CMIP7 revision makes that structure impossible to maintain without explanation.
5. The Conflation
In 2014, then US President Barack Obama tweeted: "97 percent of scientists agree: #climate change is real, man-made and dangerous."
The Cook et al. study he was citing never used the word dangerous. It was not in the study. That word was added. The authority of the attribution consensus was being used to validate a claim about consequences that no consensus study had ever measured.
This pattern is not an isolated error. It became a structural feature of climate communication. The mechanism works in two steps. First, invoke the attribution consensus to establish authority: 97% of scientists agree. Second, present SSP5-8.5-derived impact projections as "what scientists say will happen." Two separate claims, each drawing on different evidence, presented as a single unified position.
On this moment, that structure is under pressure it cannot easily sustain. The scenario that underpinned the consequences narrative has been formally labelled implausible by the researchers who built it. The content of Layer 3 has been substantially revised. And the questions raised by satellite observations, pre-industrial temperature records, and low-sensitivity analyses suggest Layer 1 itself was never as settled as the consensus headline implied.
Hausfather (2025) estimated that the central projection for warming by 2100, accounting for current and announced climate policies, is now likely below 3.0 degrees. That is a material difference from the 4.4 degrees that accompanied the 97% claim in most public communication over the preceding decade.
The scientists who labelled SSP5-8.5 implausible, including Van Vuuren, Hausfather, Peters, and Ritchie, all accept the attribution consensus without reservation. Their critique is about the emissions pathway, not about the cause of observed warming. These are not incompatible positions. They represent precisely the three-layer distinction that the attribution studies never addressed and were never designed to address.
For a detailed local investigation of the CO2 attribution question using long-term geological evidence, see CO2 Does Not Drive Global Temperature on this site. For the distinction between natural and human-caused forcing in observed climate trends, see Natural Forces Driving Current Climate Patterns.
6. What Still Stands and What Does Not
| Claim | Status after CMIP7 |
|---|---|
| Human activities are the sole or dominant cause of warming | Contested. Attribution studies confirm some human influence exists. They do not confirm dominance over natural variability. Pre-industrial records (GISP2 ice cores, Holocene Optimum) show comparable warming without human forcing. UAH satellite data (Spencer & Christy) shows warming well below model projections. |
| The science is "settled" on future warming magnitude | Future warming was never a consensus claim. It is scenario-conditional and has changed. |
| Business as usual leads to 4.4°C by 2100 | Displaced. Built on SSP5-8.5, now formally labelled implausible by its authors. |
| We are heading for the worst case | Hausfather (2025): central estimate now likely below 3°C under current policy trajectory. |
| 97% of scientists agree the consequences will be catastrophic | Not what the studies measured. They measured past attribution, not future consequences. |
The scientists waiting on this revision to reach public consciousness are, in many cases, the same researchers who accept Layer 1 without reservation. Their argument is not that climate change is harmless. It is that the specific numbers defining "catastrophic" were derived from a pathway that has now been formally removed from the plausible range.
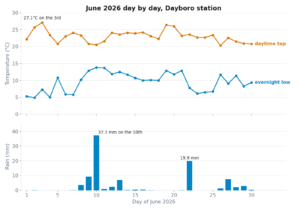
Local climate data for Dayboro records measured temperature and rainfall trends since observations began that tell their own story, separate from any global model. That data is explored at Dayboro Climate Trends and in the 2026 Climate Outlook. What the valley actually experiences in temperature, frost, and rainfall follows patterns that long range forecasting methods have tracked with reasonable consistency, independent of which emissions scenario is in circulation.
7. Policy Implications: What Needs Updating
The institutions that built risk frameworks on SSP5-8.5 face a recalibration that has been clear since several years before CMIP7 made it official.
The Network for Greening the Financial System Hot House World scenario is used by more than 140 central banks for climate financial stress testing. It was calibrated to RCP8.5. Those stress tests shape how insurers, pension funds, and banks assess climate exposure. They were built on a scenario the scenario architects have now labelled implausible. Updating them to the new CMIP7 HIGH does not remove climate risk. It shifts the risk calculation from a 4.4 degree world to a 3.0 degree world. That is a material difference in how physical and transition risks are modelled and priced.
The US NCA5 and Australia's Climate Change in Australia projections both rely on SSP5-8.5 for their impact estimates. Both will need revision to remain scientifically credible. The scenario framework has moved. The national assessments have not.
For Australian growers and rural communities, this matters in a direct sense. The crop yield loss projections cited in federal planning documents, the agricultural risk assessments used for financing and adaptation, and the regional plans built on SSP5-8.5 assumptions all assumed a coal heavy world that even the scenario's own authors say is not coming. Tools like Garden Buddy, which provide climate zone planting calendars calibrated to Australian conditions, work from measured local data rather than global model projections. That grounded approach produces practical guidance regardless of which scenario framework is current. Growers making decade-scale decisions deserve projections built on plausible futures, not stress test boundaries.
For specific policy analysis, this site has examined the US EPA's proposed changes to CO2 regulation in Is the EPA Repeal on CO2 Correct? and the divergence between modelled projections and local observations in Reality Versus BOM.au. Both touch on the broader pattern of what models assume versus what measured data records.
8. Conclusion
The CMIP7 revision is not the only challenge to the climate narrative built around SSP5-8.5. The attribution studies that produced the 97% headline measured a narrow question: whether position-taking scientists accept some human influence on observed warming. What they did not settle was whether that influence is dominant over natural variability, or whether current temperatures are unusual within the full Holocene record. The satellite temperature data, the Greenland ice core record, and low climate sensitivity analyses each raise those questions independently of anything CMIP7 does.
What the revision shows is that the consequence narrative built on top of that consensus rested partly on a scenario the scenario architects themselves have now formally labelled implausible. Science corrects itself. That is not a failure. The nine years it took for this correction to reach the official record, while SSP5-8.5 was embedded in central bank stress tests, national assessments, and thousands of impact studies, is the part worth examining carefully.
The three layers of climate knowledge have always been separate. Layer 1 attribution rests on direct measurement and historical records. Layer 2 projections are scenario-conditional and have always carried uncertainty ranges. Layer 3, the business as usual framing, was a communication construct that the researchers themselves never endorsed as a description of current trends. CMIP7 makes that separation impossible to ignore.
Long range forecasting in Australia has a deep history of working from astronomical and cyclical analysis rather than emissions model outputs. That tradition was embodied in the Inigo Jones methodology developed at Crohamhurst Observatory in the Sunshine Coast hinterland, a tradition continued today at Crohamhurst. The cycle-based approach raises its own questions about what belongs in any credible model of future climate and what is simply an artefact of the assumptions you start with.
One word changed the terms of this debate. That word was implausible. It was published quietly, in a journal most climate reporters had not read, without a press conference, without an announcement. The rest of the conversation will take longer to catch up.
Related Reading on Dayboro.au
References
Van Vuuren, D.P., Riahi, K., Ebi, K., Edmonds, J., Ficke, A., Fraser, A., Fujimori, S., Harmsen, M., Hasegawa, T., Havlik, P., Hilaire, J., Huppmann, D., Keppo, I., Kobayashi, S., Kriegler, E., Luderer, G., Masui, T., Rao, S., Rogelj, J., ... & Zimm, C. (2026). The Scenario Model Intercomparison Project for CMIP7 (ScenarioMIP-CMIP7). Geoscientific Model Development, 19, 2627–2656. https://doi.org/10.5194/gmd-19-2627-2026
IPCC (2021). Summary for Policymakers. In: Climate Change 2021: The Physical Science Basis. Contribution of Working Group I to the Sixth Assessment Report of the Intergovernmental Panel on Climate Change. Masson-Delmotte, V., et al. (Eds.). Cambridge University Press.
IPCC (2013). Summary for Policymakers. In: Climate Change 2013: The Physical Science Basis. Contribution of Working Group I to the Fifth Assessment Report of the Intergovernmental Panel on Climate Change. Stocker, T.F., et al. (Eds.). Cambridge University Press.
Cook, J., Nuccitelli, D., Green, S.A., Richardson, M., Winkler, B., Painting, R., Way, R., Jacobs, P., & Skuce, A. (2013). Quantifying the consensus on anthropogenic global warming in the scientific literature. Environmental Research Letters, 8(2), 024024. https://doi.org/10.1088/1748-9326/8/2/024024
Lynas, M., Houlton, B.Z., & Perry, S. (2021). Greater than 99% consensus on human caused climate change in the peer-reviewed scientific literature. Environmental Research Letters, 16(11), 114005. https://doi.org/10.1088/1748-9326/ac2966
Powell, J.L. (2019). Scientists reach 100% consensus on anthropogenic global warming. Bulletin of Science, Technology & Society, 37(4), 183–184. https://doi.org/10.1177/0270467619886266
Hausfather, Z., & Peters, G.P. (2020). Emissions, the 'business as usual' story is misleading. Nature, 577, 618–620. https://doi.org/10.1038/d41586-020-00177-3
Pielke, R., & Ritchie, J. (2021). Distorting the view of our climate future: The misuse and abuse of climate pathways and scenarios. Energy Research & Social Science, 72, 101890. https://doi.org/10.1016/j.erss.2021.101890
KC, S., Moradhvaj, Verbeet, A., Marois, G., & Bhatt, S. (2024). Shared Socioeconomic Pathway 3: Population Projections and Socioeconomic Assumptions. IIASA Working Paper WP-24-003. International Institute for Applied Systems Analysis.
American Meteorological Society. (2012). Member Survey on Climate Change. AMS Policy Program, Washington DC.
Tol, R.S.J. (2014). Quantifying the consensus on anthropogenic global warming in the literature: A re-analysis. Energy Policy, 73, 701–705. https://doi.org/10.1016/j.enpol.2014.04.045
Spencer, R.W., & Christy, J.R. (1990). Precise monitoring of global temperature trends from satellites. Science, 247(4950), 1558–1562. https://doi.org/10.1126/science.247.4950.1558
Spencer, R.W., & Braswell, W.D. (2011). On the misdiagnosis of surface temperature feedbacks from variations in Earth's radiant energy balance. Remote Sensing, 3(8), 1603–1613. https://doi.org/10.3390/rs3081603
Alley, R.B. (2000). The Younger Dryas cold interval as viewed from central Greenland. Quaternary Science Reviews, 19(1–5), 213–226. https://doi.org/10.1016/S0277-3791(99)00062-1
Stuiver, M., & Grootes, P.M. (2000). GISP2 oxygen isotope ratios. Quaternary Research, 53(3), 277–284. https://doi.org/10.1006/qres.2000.2127
Ljungqvist, F.C. (2010). A new reconstruction of temperature variability in the extra-tropical Northern Hemisphere during the last two millennia. Geografiska Annaler: Series A, Physical Geography, 92(3), 339–351. https://doi.org/10.1111/j.1468-0459.2010.00399.x
Get Dayboro weather delivered to your inbox every morning — forecasts, garden tips, and local updates. Subscribe free →