
May 2026: April's Report Card, and What's Coming Next
What my Lyndhurst Hill station actually recorded last month, how the forecasts held up, and two outlooks for the weeks ahead: BOM and the Dayboro Station's own pipeline.
April's numbers are in and I'm not going to dress them up. My Inigo Jones pipeline called for about 117mm. The station recorded 45.4mm. That's a significant miss, and it's worth understanding why before I ask you to trust the May forecast. So let me do that first, then we'll look at where things are heading.
April 2026: What Actually Happened
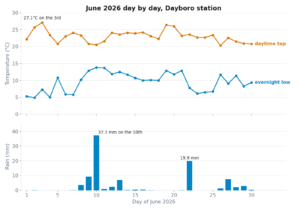
My station at Lyndhurst Hill ran 5-minute polling through all 30 days of April. Here's the summary.
The month split cleanly into two phases. The first 24 days delivered 11.3mm, the whole lot. Then the last six days brought a proper wet spell: 34.1mm from the 25th to the 30th, with the 25th (9.5mm) and 26th (6.2mm) doing most of the work. Max gust during the event was 40 km/h from the south east on the 27th. Not dramatic, but it came after a long dry stretch and the soil was grateful.
The 13 year station average for April is 142mm. Our 45.4mm ranks as the third driest April in the record, behind 2016 (15.9mm) and 2008 (25.9mm). Rain days: 8 out of 30. Average humidity for the month was 78.7%, a touch below the historical April average. There were two genuinely dry air days in mid April, the 12th and 13th, where relative humidity dropped to 52 and 59% respectively. That mid month cold snap with 10°C nights arrived since those two dry days and felt sharp after the warm start.
How the Forecasts Held Up
In my autumn 2026 outlook from the 9th of April, I put two forecasts on the table for the rest of that month and for May. Here's how they performed.
| Metric | Prediction (9 April) | Actual | Verdict |
|---|---|---|---|
| April total rainfall | ~117mm (Inigo Jones) | 45.4mm | Miss. 72mm short. |
| Main rain window | 17–25 April (50–55% PoP) | 25–30 April | Delayed by ~1 week |
| Rain before 16 April | ~0 (Dayboro Model) | 11.3mm to 24 April | Correct. Dry start. |
| Average min temperature | 13–14°C (Inigo Jones, 2nd half) | 13.9°C monthly avg | Accurate |
| Daytime highs (17–30 Apr) | 25–27°C (Inigo Jones) | Low to mid 20s | Broadly correct |
| Climate driver signal | Positive IOD suppressing rainfall | 45mm vs 142mm avg | Correct direction |
My read on what went wrong: Inigo Jones got the direction right (drier than average) and the temperature profile right. It missed the magnitude badly. The wet event that arrived at the end of April was smaller and later than the pipeline forecast. The Dayboro Model (8 day window only) was accurate for the dry start.
The positive Indian Ocean Dipole (IOD) that I flagged in early April continued to work as expected, suppressing rainfall across eastern Australia. That signal was correct. The 45mm outcome is consistent with what a positive IOD typically delivers: below average, not drought, rainfall arriving late and in short bursts rather than extended wet spells.
May 2026: Two Outlooks
I want to do something a bit different this month and put two forecasts side by side: what BOM is saying for the region, and what the Dayboro Station's own Inigo Jones pipeline is forecasting for the valley. Where they agree, that's worth noting. Where they differ, I'll tell you which one I'm watching more carefully and why.
Regional Seasonal Outlook
- Rainfall: Below average likely. BOM's own words: "strongest signal for below average rainfall in May" across much of eastern Australia including southern Queensland.
- Night temperatures: Very likely above average across most of Australia, including SEQ.
- Day temperatures: Greater than 70% chance of above average maximum temperatures for southern Queensland.
- ENSO: Neutral now (Niño3.4 at +0.23°C), but warming. El Niño possible by July. BOM notes the autumn predictability barrier makes this uncertain.
- IOD: Neutral (+0.09°C), positive IOD developing possible by June–July.
Local Valley Forecast
- Rainfall: ~95mm for May. Average rainfall is 142mm so this is below average, consistent with BOM's signal.
- Night temperatures: Average minimum forecast 10.5°C. Historical May avg minimum is 6.5°C, so significantly warmer nights than usual. Agrees with BOM.
- Day temperatures: Average maximum forecast 23.4°C vs historical May avg of 27.3°C. The station model suggests cooler than average days, not warmer. This is the main point of disagreement with BOM.
- Key rain window: new moon period 17–18 May, 70% probability of precipitation. Full moon period around 2 May also flagged (60% PoP).
- Long settled spell late May (21–30), mostly dry, 10–25% PoP.
On the day temperature question, I'll be honest: I'm not sure which is right. BOM says warmer than average days. My Inigo Jones pipeline says cooler than average days. The historical May average for Dayboro days is 27.3°C and my forecast average is 23.4°C. That's nearly a 4 degree difference. The station model could be weighting the lunar cooling signals in the new moon period too heavily. Or BOM's gridded model could be averaging out local topographic effects. I'll be watching the Dayboro Model's 8 day updates through the month and will update this on the Weather Hub if the picture changes materially.
Where both agree is more important: below average rainfall, warmer than usual nights. That consensus is fairly clear.
The Dayboro Model in Detail: May 1 to 9
The Dayboro Model currently covers the first 9 days of May at high resolution. Here's what it's showing.
Dayboro Model: 1 to 9 May 2026
| Date | Max | Rain chance | Conditions |
|---|---|---|---|
| Fri 1 May | 27°C | 0% | Partly cloudy AM, mostly sunny PM. Light fog early. |
| Sat 2 May | 27°C | 30% | Partly cloudy. Chance of rain or thundershower in the morning. Full moon window. |
| Sun 3 May | 24°C | 0% | Mostly cloudy. Fog. |
| Mon 4 May | 28°C | 0% | Partly cloudy morning, sunny afternoon. |
| Tue 5 May | 26°C | 0% | Partly to mostly cloudy. Light fog. |
| Wed 6 May | 26°C | 40% | Mostly cloudy. Chance of rain. East winds. |
| Thu 7 May | 25°C | 0% | Partly cloudy morning. |
| Fri 8 May | 26°C | 0% | Partly cloudy afternoon. |
| Sat 9 May | 27°C | 0% | Partly cloudy. |
Inigo Jones: Three Phases for the Month
Beyond the 9 day Dayboro Model window, my Inigo Jones pipeline covers the full month. I run this from the forecastlab database, updated daily. For May 2026 the pattern breaks into three fairly distinct phases.
Early May (1–7): Mild and mostly dry. The full moon window around the 2nd has a 60% probability of showers, the highest of the first week. Otherwise 10–20% PoP through to the 7th. Forecast maxima 23–25°C, minima 10–12°C.
Mid May (8–20): A settled patch through the 8th to 15th (15–20% PoP, mostly sunny). Then the main event of the month: the new moon period. The 17th (55% PoP), 18th (70% PoP), and 19th (60% PoP) are the three days I'm watching most closely. If the May rain comes, most of it will come here. Maxima drop to 20–22°C during this window.
Late May (21–31): A long settled spell. The 21st to the 30th is mostly sunny with 10–25% PoP. Then the cycle turns again at month's end: the 31st flags a 60% PoP as the next new moon approaches and June begins.
Frost Risk: Warmer Than Average Nights Expected, But Not Zero
Both BOM and my Inigo Jones pipeline are pointing to warmer than usual nights this May. My forecast average minimum is 10.5°C versus the historical average of 6.5°C. That's a meaningful difference. It suggests the risk of May frost on the valley floor and exposed low paddocks is lower than in a typical year.
Lower doesn't mean zero. The pipeline's coldest forecast night is 9.6°C on the 21st. On clear nights with a dew point drop, the valley floor and frost hollows can eventually see temperatures 2–3°C below what the ridge station records. So for anyone with cold sensitive plants in a low spot, I wouldn't write off frost protection altogether. But the risk is reduced compared to years like 2023 where my May average minimum was 4.7°C.
What to Do in May
If I had to give you three things to focus on in May, this is what I reckon matters.
In the garden: The soil is still warm enough to germinate most cool season crops, but that window is closing fast. Brassicas (broccoli, cabbage, cauliflower), leafy greens, and root vegetables planted now will establish before the cold nights of June arrive. Anything you put in after the middle of the month is taking a risk on establishment. I mulch everything heavily through May, the ground dries out faster than you'd expect between rain events and your seedlings can't wait on the next shower.
For hay and pasture: The early May dry window (1–14) is good cutting weather if you've got standing grass. The Inigo Jones model shows a potential wet patch opening around the 17th. I'd aim to have anything cut and baled or at least turned before the 15th to give yourself margin. After that I'd wait and see what the new moon window delivers.
Watch for the new moon window: The 17th to 19th of May. If the Inigo Jones pattern holds, this is where most of the month's rain arrives. On this moment the probability of precipitation peaks at 70% on the 18th. That's not a certainty, but it's significant enough to plan around. If you're relying on tank water or the creek is low, this is the window to watch.
My daily Dayboro email goes out before sunrise. Current station conditions, 14 day valley forecast, garden timing and what the Inigo Jones pipeline updated overnight. Everything I look at every morning, sent to you.
Start Weather Reports, $3.95/mo →The forecast accuracy dashboard tracks how the Inigo Jones and Dayboro Model predictions are tracking against real station data. You can see the April miss there. I update it as the month goes. That's also the most honest way I know to communicate the uncertainty in what I've written above.
Local Businesses Supporting Dayboro.au
These are the local businesses currently advertising on this site. They help keep it running. Click any to visit them directly.
Loading local businesses…
Running a business in Dayboro or the Samford Valley? Your customers are reading this.
Data Sources & Methodology
Station data: Dayboro Weather Station, Lyndhurst Hill (27.18°S, 152.83°E, 72m elevation). Ecowitt GW2000 + WS90 sensor suite. Archive from 2005, 5-minute polling interval, MariaDB via WeeWX.
April 2026 figures: Queried directly from weewx_db archive, 8,637 records, 1–30 April 2026, verified in usUnits=17 (metric). Historical April average of 142mm from 13 complete years (2008–2025, excluding data quality gaps).
Dayboro Model: Numerical weather prediction calibrated for Dayboro microclimate. Updated daily at 06:00 AEST. 8 to 9 day window. Last update used: 1 May 2026 07:17 AEST.
Inigo Jones forecast: Long range analogue method using planetary and lunar cycle multipliers. May 2026 full month data from forecastlab.WX_InigoJones_daily_simple (31 entries confirmed). Confidence for May: moderate. Updated daily at 03:00 AEST.
Historical May averages: 13 complete years (2008–2025, excluding 2006, 2020, 2021 due to data quality issues). May historical average rainfall 142mm, range 17mm to 562mm. May avg maximum 27.3°C, avg minimum 6.5°C.
BOM seasonal outlook: Long-range forecast issued 30 April 2026. ENSO status from BOM monitoring week ending 26 April 2026 (Niño3.4 +0.23°C, neutral). IOD from BOM monitoring 26 April 2026 (+0.09°C, neutral). El Niño trajectory from WMO Global Seasonal Climate Update, 21 April 2026. BOM did not publish sub-regional probability percentages for the Moreton Bay area in retrievable text; qualitative language ("likely", "very likely") is used in their releases as cited.
Links: Weather Hub (live station data) · Forecast accuracy dashboard · Autumn 2026 outlook (April–May predictions)
Get Dayboro weather delivered to your inbox every morning — forecasts, garden tips, and local updates. Subscribe free →