We can now see Kobble Creek, Laceys Creek, and Young's Crossing, live
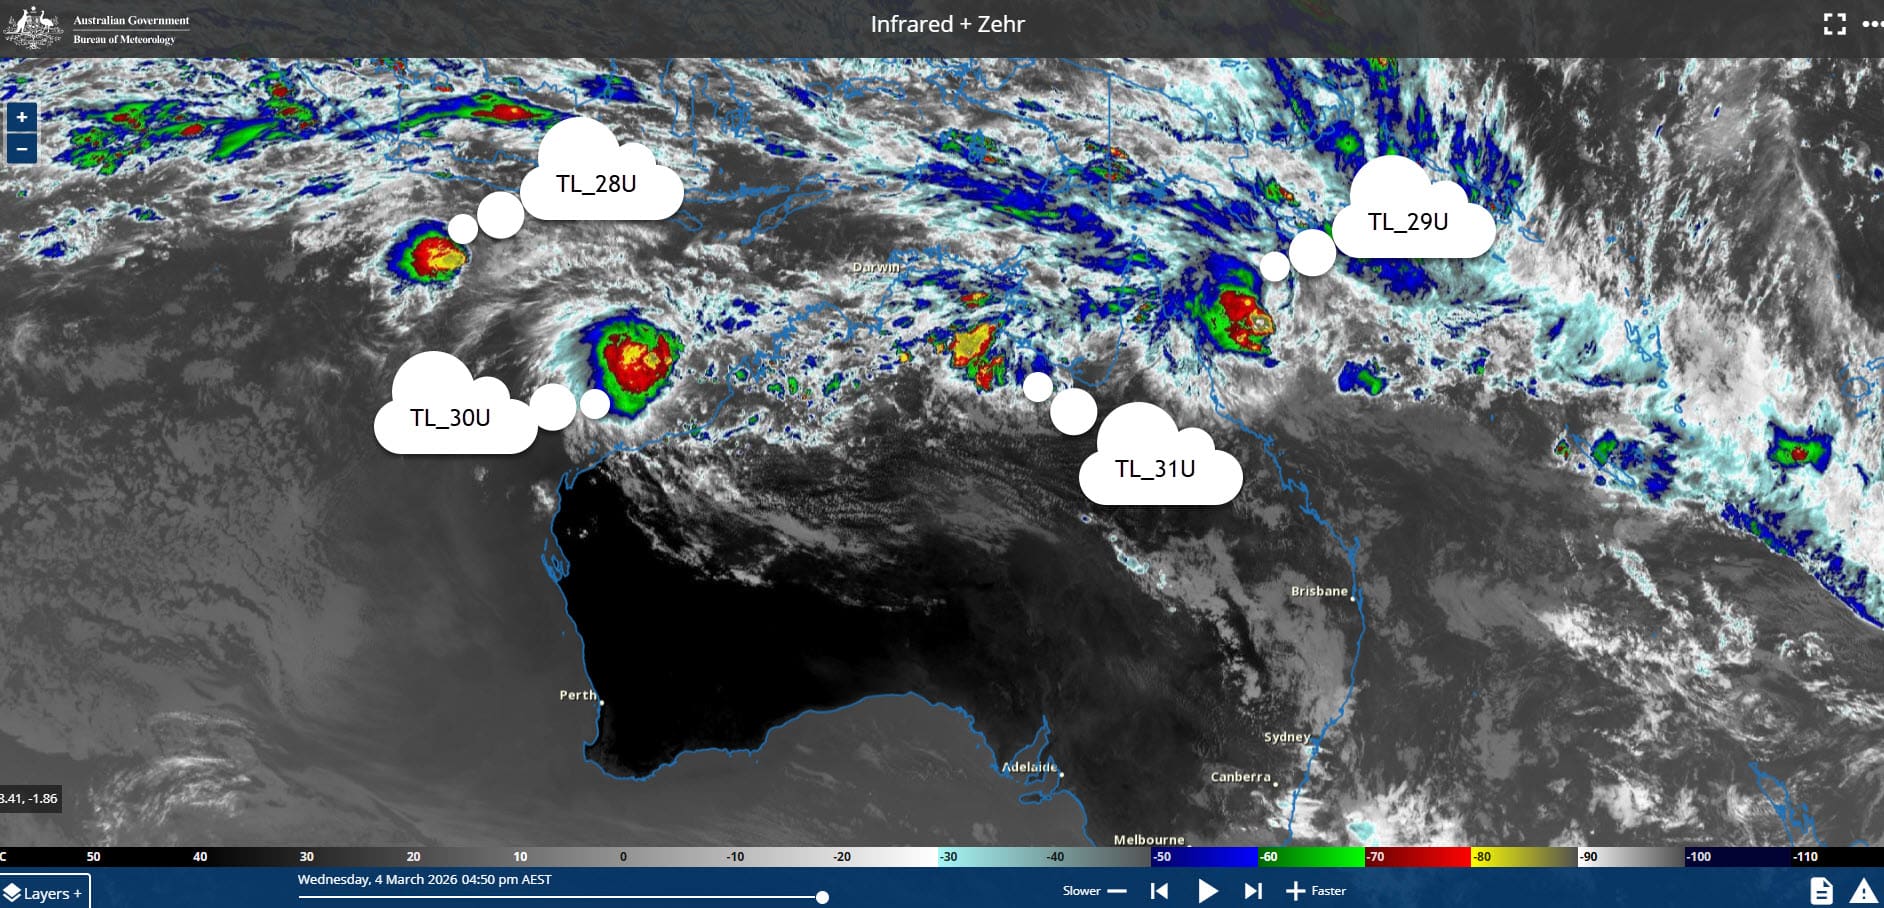
Four tropical lows tracking the northern coast in early March. Systems like these are what fill the North Pine catchment.
If you've ever turned onto Samson Road wondering whether Kobble Creek has come up since you left home, or driven towards Lees Crossing not knowing if the water's gone down after last night's rain, this update is for you.
We've added live BOM creek level readings to the Current Weather Conditions & Warnings page. Five crossings, updated every 10 to 120 minutes depending on how much rain is falling, straight from the Bureau's river heights network. And alongside the live readings, a 7-day crossing risk forecast built from our flood calendar and historical data.
Here's what's there, how it works, and what to look for.
What the Warnings Page Already Does
The warnings page has been running for a while. It pulls from the Lyndhurst Hill weather station every 5 minutes and flags anything worth knowing about: heat warnings when temperatures push past 35°C, UV alerts when the index climbs above 6, high fire danger from the local FFDI, heavy rain when the rate goes above 10mm/hr, and so on.
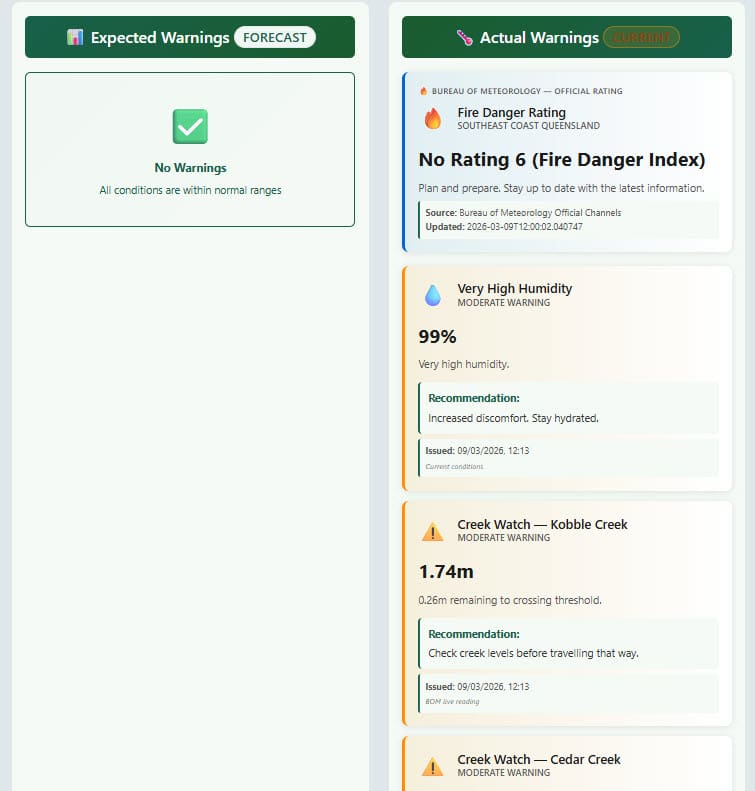
There are two columns. The left side shows Expected Warnings, what's forecast to happen in the next day or two based on the Dayboro Model. The right side shows Actual Warnings, what's happening right now from the station. BOM's official warnings for the region appear in a banner across the top when they're active.
It's a decent page for thunderstorm days or fire danger periods. But until now, it had nothing about creek crossings. Which, if you've been here for more than one wet season, is often the thing that actually matters.
What's New: Creek & Crossing Conditions
We're now pulling live river heights from BOM's IDQ60286 bulletin, the same data the Bureau's network collects, just presented for the crossings that matter to people in and around Dayboro.
Five crossings are monitored:
- Terrors Creek Dayboro township area
- Kobble Creek Mt Samson Road
- Lees Crossing North Pine River
- Young's Crossing North Pine River, 1.20m below causeway
- Drapers Crossing South Pine River
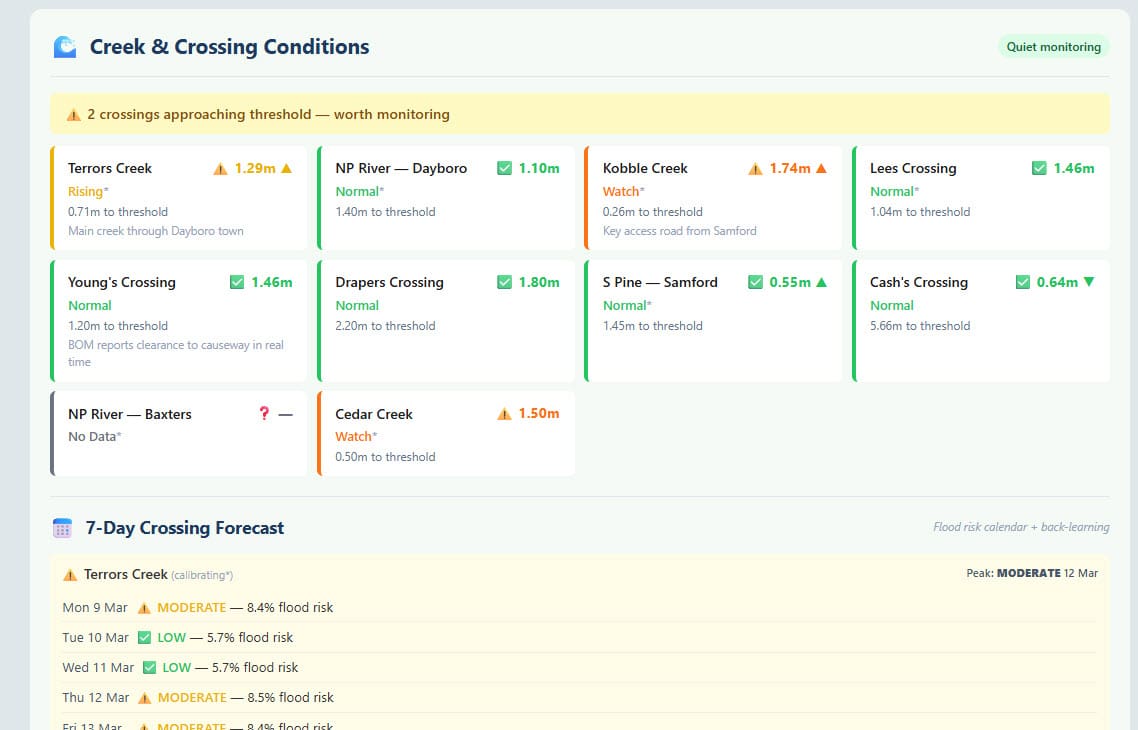
Each one shows current height in metres, whether it's rising or falling, and how much clearance remains to the crossing threshold. Young's Crossing, for example, has a measured threshold of 2.66m, confirmed from BOM's own data showing it's 1.20m below the causeway. At 1.46m and steady, it has 1.20m of headroom. At 2.0m and rising fast, it's a different conversation.
Status Levels
Each station is assigned one of four statuses based on how close it is to its threshold:
If any crossing reaches Watch or above, a banner appears at the top of the creek section saying how many crossings are affected. Those stations also generate a warning card in the Actual Warnings column, same place as the heat and fire alerts, so you see the creek status the moment you open the page.
The 7-Day Crossing Forecast
Below the live readings, there's a 7-day crossing forecast for each station. This one's a bit different, it's not from BOM, it's from us.
Our 60-day flood risk calendar already assigns a flood probability to each day of the year based on historical patterns, Inigo Jones cycle analysis, and seasonal indicators. What the forecast does is connect those probabilities to actual creek behaviour.
For each crossing, the system looks at the last 90 days of creek readings and tries to find a correlation: when the flood probability was X%, what did this crossing typically reach? If there are enough observations, it fits a simple regression, probability in, predicted height out. Apply that to the next 7 days of the calendar and you get a forward-looking risk estimate per crossing per day.
When we only have a handful of readings (the data collection started this month), it falls back to a rule-based mapping: below 6% flood probability is LOW risk, 6–12% is MODERATE, 12–25% is ELEVATED, above 25% is HIGH. These are conservative estimates, clearly marked as calibrating. They'll improve over the coming weeks and months as more creek readings come in.
Any crossing with an ELEVATED or HIGH peak risk in the 7-day window also generates a card in the Expected Warnings column, so the crossing risk sits alongside forecast heat and rain warnings where you'd naturally look for it.
Where to Find It
It's all on the Current Weather Conditions & Warnings page. The creek section sits between the main warnings columns and the legend at the bottom. Everything updates on the same 5-minute cycle as the rest of the page, you don't need to refresh manually.
If you're heading out towards Samson Road after heavy rain, or wondering whether Lees Crossing is open after an overnight storm, that's the page to check. Bookmark it.
The data comes from BOM's official river heights network. We're just putting it in one place with context for the specific crossings locals actually use.
Get Dayboro weather delivered to your inbox every morning — forecasts, garden tips, and local updates. Subscribe free →