March 2026: A Month of Two Halves
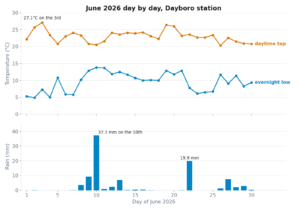
I reckon March 2026 couldn't make up its mind. The first half dumped 208mm on us, launched a thunderstorm with 50,000 strikes on Friday the 13th, and hit 35.4°C the day before. Then the second half basically dried up on me, delivered a 10°C overnight low on the 28th, and quietly slipped into autumn while nobody was looking.
The result? A month that was warmer than average during the day, cooler than average at night, and wetter than normal overall. Almost all that rain was crammed into the first two weeks. If you were trying to mow the lawn, you had a narrow window. If you were trying to fill water tanks, you had a golden fortnight.
How March Played Out, Week by Week
The month opened with classic late summer weather: clear skies, temps pushing 32°C, UV index hitting 11.0 on the 3rd (that's "stay inside or regret it" territory). A deep trough was building across northern Queensland. Tropical Low 29U had already dumped 200mm+ on the far north coast. Down here in Dayboro, we were still dry and sticky, humidity sitting around 80% and the afternoon storms jsut starting to rumble.
This was the main event. A persistent rain band parked itself over the D'Aguilar Range and didn't move for 60 hours. The 8th copped 88mm alone, our wettest day of the month by a mile. Maximum temperature barely scraped 23.9°C (seven degrees below normal), humidity sat at 99% all day, and the sun essentially didn't show up. Solar radiation peaked at just 178 W/m², roughly what you'd expect at dawn on a clear day.
By the 9th, another 48mm had fallen, atmospheric pressure had dropped to 1003.4 hPa (the month's lowest), and every creek in the valley was running hard. Soil moisture jumped from 39% to 86% in two days.
The 10th cleared beautifully. By the 12th we'd hit 35.4°C, the month's hottest day, with a heat index touching 43°C. Oppressive stuff. Dewpoints up around 25°C, the sort of air that makes you feel like you're breathing through a wet towel.
Then Friday the 13th lived up to its name.
Things calmed down. We had nine days averaging 29.7°C with only 17mm of rain between them. Soil moisture steadily dropped. A secondary thunderstorm cluster on the 22nd–24th produced another 14,105 lightning strikes but only 17.4mm of rain. More bark than bite.
Meanwhile, Severe Tropical Cyclone Narelle was making headlines up north. Category 5 in the Coral Sea, landfall near Coen on the 20th at Category 4 with 285km/h gusts, then across the NT and into WA. Only the fourth cyclone in recorded history to make triple landfalls. It didn't hit us directly, but it was pulling moisture out of our region. One reason the second half of the month was so dry down here.
A dry westerly change blew through on the 27th with a 45km/h gust. Humidity plummeted to 38%, the lowest all month. The following morning (28th), the temperature dropped to 10.0°C at 6:25am. That's the 3rd coldest March night in our 13 year station record. Only March 2008 has produced colder (8.7°C and 9.8°C).
Just like that, summer was done. The grassfire danger index briefly spiked to 57 (High) on the 28th, the only time all month it got above Low.
March 2026 vs. the History Books
My weather station has logged data for 13 March months since 2008. Here's where 2026 sits in that record.
| Metric | March 2026 | 13 Year Average | Departure |
|---|---|---|---|
| Average daily max | 30.0°C | 28.5°C | +1.5°C (warmer) |
| Average daily min | 17.2°C | 18.3°C | −1.1°C (cooler) |
| Diurnal range | 12.8°C | 10.2°C | +2.6°C (widest on record) |
| Total rainfall | 251.9mm | 258.3mm | −6.4mm (near average) |
| Rain days (≥1mm) | 11 | 11.9 | Near average |
| Hottest day | 35.4°C (12 Mar) | 6th hottest March day on record | |
| Coldest night | 10.0°C (28 Mar) | 3rd coldest March night on record | |
Where does 2026 rank?
- Rainfall: 5th wettest March (out of 13 years). Not extreme. 2025 dumped 747mm and 2010 dropped 603mm.
- Average max temp: 3rd hottest March. Only 2023 (31.4°C) and 2025 (30.3°C) were warmer.
- Average min temp: 2nd coldest March. Only 2008 (15.7°C) was cooler overnight.
- Wettest single day: The 88mm on the 8th doesn't crack the top 5. March 2025's single day record of 301mm puts it in perspective.
The rainfall range across my 13 year March record is staggering: from 7.2mm in 2015 to 747mm in 2025. That's a 100 fold difference. March in southeast Queensland is nothing if not inconsistent.
Forecast Accuracy: Who Got March Right?
This is the bit the data nerds have been waiting on. I run three forecast models here: the Dayboro Model (my own hyperlocal numerical weather model), the Bureau of Meteorology's official forecast, and the Inigo Jones method (long range analogue forecasting based on planetary and lunar cycles). Each gets compared against what the station actually recorded.
No single model won everything. Each had a clear strength, and a clear weakness.
Maximum Temperature
| Metric | Dayboro Model | BOM | Inigo Jones |
|---|---|---|---|
| Mean Absolute Error | 1.35°C ★ | 1.59°C | 2.59°C |
| Within 1°C | 45% (13 of 29 days) | 32% | 26% |
| Within 2°C | 83% | 68% | 39% |
| Days won | 15 | 9 | 6 |
Winner: Dayboro Model. My home grown model nailed maximum temperatures better than either competitor, getting within 1°C nearly half the time and within 2°C on 83% of days. The BOM was solid but consistently under predicted highs by about 1.2°C. Inigo Jones struggled here, under predicting by 1.8°C on average.
Minimum Temperature
| Metric | Dayboro Model | BOM | Inigo Jones |
|---|---|---|---|
| Mean Absolute Error | 2.91°C | 2.42°C | 1.97°C ★ |
| Within 2°C | 48% | 39% | 61% |
| Within 3°C | 68% | 71% | 84% |
| Days won | 7 | 8 | 15 |
Winner: Inigo Jones. The oldest method beat both modern models on overnight lows. Inigo's mean error was nearly a full degree better than my Dayboro Model and half a degree better than BOM. All three models over predicted minimums (forecasting warmer nights than actually occurred), but Inigo had the most balanced bias, just +0.22°C versus BOM's −2.4°C over prediction. That abnormally cold final week caught everyone off guard, but in my view Inigo handled it best.
Rainfall
| Metric | Dayboro Model | BOM | Inigo Jones |
|---|---|---|---|
| Total forecast | 441mm | 57mm | 244mm |
| Actual total | 251.9mm | ||
| Error | +75% (over) | −77% (under) | −3% |
| Rain day detection | 92% (12 of 13) | 46% (6 of 13) | 77% |
Total accuracy: Inigo Jones. Off by just 8mm over the entire month. Remarkable for a method based on planetary cycles rather than atmospheric modelling. My Dayboro Model over predicted by 75% (it knew it would rain, just went too heavy). BOM under predicted severely, forecasting only 57mm against 252mm actual, and missed detecting rain on 7 of 13 rain days.
Day to day detection: Dayboro Model. If the question was "will it rain tomorrow?", my local model got it right 92% of the time. Useful if I'm deciding whether to cut hay.
The Scorecard
Dayboro Model
Struggled with min temps (2.91°C MAE)
Bureau of Meteorology
Under predicted both rain (−77%) and max temps
Inigo Jones
Weakest on max temps (2.59°C MAE)
Combined Best
Nobody swept the board
What BOM Predicted for March
The Bureau's seasonal outlook for March–May 2026, issued in late February, called for no strong signal for wetter or drier than average rainfall in southeast Queensland. The ENSO had returned to neutral after the 2025–26 La Niña ended in mid February. Temperatures were expected to be warmer than average, which for daytime highs at least turned out correct.
For Dayboro specifically, BOM's day to day rainfall forecast totalled just 57mm for the month. I thought that looked optimistic, and the actual 252mm proved it. The big 7–9 March rain event was partly driven by the same deep trough that sent Tropical Low 29U across the north coast. Widespread systems like that are hard to quantify in a 7 day city forecast days in advance.
To BOM's credit, their severe thunderstorm warning on the 13th was timely and specific. They named Dayboro in the warning area at 2:25pm, the storm hit at 2:45pm. Twenty minutes' notice for a life threatening flash flood event. That's the kind of thing that saves lives, and it's worth acknowledging even when their monthly rainfall estimate was way off.
The Bigger Picture: ENSO and Cyclone Narelle
March 2026 sat at a climate crossroads. The La Niña that had pumped moisture into eastern Australia since late 2025 officially ended in mid February, with ENSO returning to neutral. But climate systems have momentum. The soil was already saturated, the Coral Sea was sitting at a record 29.5°C, and the atmosphere still had tropical moisture to burn through.
That residual energy fuelled two major events: the 7–9 March rain band and Severe Tropical Cyclone Narelle. Narelle was a beast. Category 5 in the Coral Sea, landfall near Coen at Category 4 on the 20th, then across the NT and into WA. Only the fourth cyclone in recorded history to make three landfalls. While it didn't directly hit us, it reorganised the moisture patterns across Queensland. The dry second half of our March was partly because Narelle dragged the tropical moisture north and west, away from the southeast.
What It Meant on the Ground
For gardeners
The first two weeks were a write off for any outdoor work in my patch. The 86% soil moisture after the 8th–9th meant waterlogged beds and fungal pressure. But the drier second half, combined with daytime temps still above 30°C, was ideal for late season tomatoes and capsicums. The 10°C night on the 28th was a reality check. If you hadn't moved frost sensitive plants undercover, they felt it.
For tanks and dams
Excellent news. The 252mm across 11 rain days was spread well enough for absorption, and the big event on the 8th would have put serious water into any catchment that wasn't already full from 2025's record March.
For fire risk
Minimal all month. The grassfire danger only spiked once (28 March, after the dry westerly change) and only to High, not Extreme. Soil moisture stayed above 40% for almost the entire month. The first real fire risk this season is still weeks away.
Want daily forecasts from all three models, plus real time accuracy tracking? Our members get the full comparison dashboard updated every morning.
See Membership OptionsAbout This Data
Station: Dayboro Weather Station (Lyndhurst Hill), 27.2°S 152.8°E, elevation ~120m. Ecowitt GW2000 + WS90 sensor array. Data logged every 5 minutes via WeeWX.
Historical record: 13 years of March data (2008–2026). Some years between 2017–2021 have incomplete records and were excluded from averages.
Forecast accuracy: Dayboro Model predictions compared against station observations using automated variation scripts. BOM comparisons use stored forecast vs actual differences. Inigo Jones uses analogue year methodology. The Dayboro Model's max temp MAE excludes 2 days with known data pipeline issues (9 and 21 March).
Lightning data: Blitzortung network via WeeWX extension. Strike counts represent detected activity within the configured detection radius.
BOM sources: Seasonal outlook (Feb 2026), severe thunderstorm warning 13/03/2026, national March 2026 summary. Full Queensland monthly summary not yet published at time of writing.
Cyclone data: BOM Tropical Cyclone tracking, Queensland Government disaster records.
Published 5 April 2026 · Dayboro Weather · View live accuracy dashboard · 2026 Climate Outlook
Get Dayboro weather delivered to your inbox every morning — forecasts, garden tips, and local updates. Subscribe free →