
Four Tropical Lows: What Does This Mean for Dayboro?
A scientific analysis of the current tropical activity across northern Australia, and an honest assessment of the probability that any of it reaches the D'Aguilar foothills.
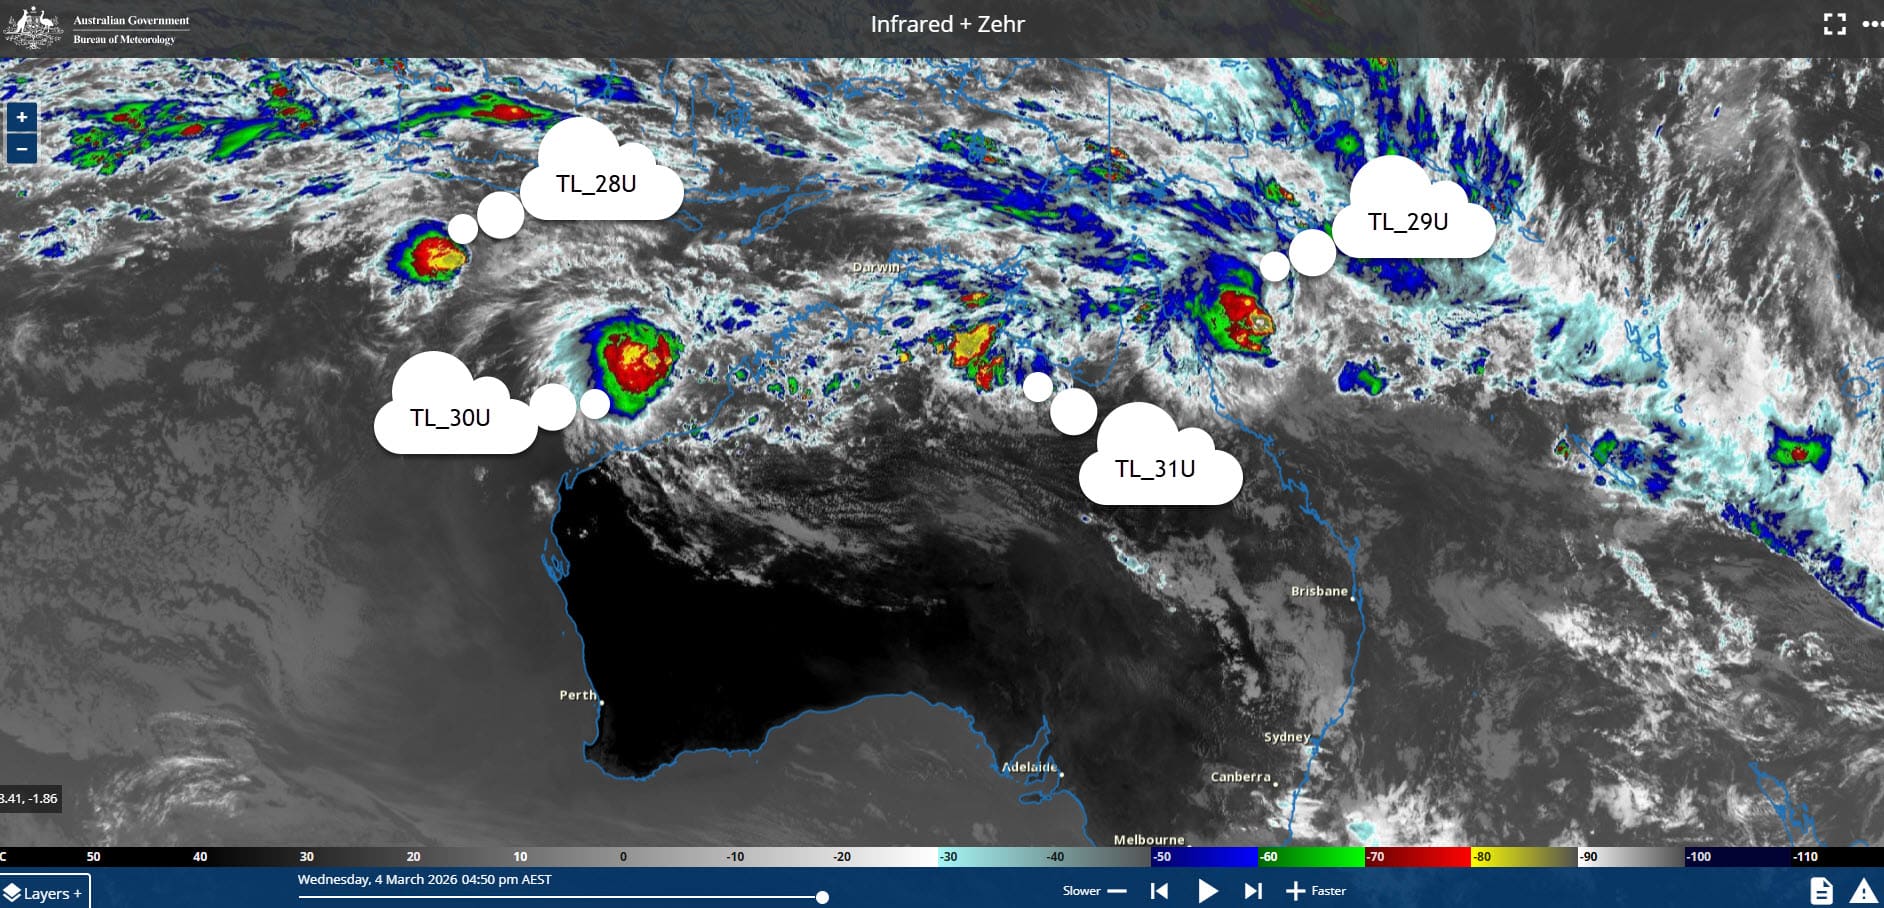
29U, Coral Sea
600 km ENE of Cairns. Watch: Cooktown to Palm Island. Landfall North Tropical Coast Friday. The only system with direct Queensland relevance this week.
28U, Indian Ocean
South of Indonesia. High formation chance but Fujiwhara interaction with 30U weakens both systems. Not expected to affect Australian mainland.
30U, Kimberley
Heavy rainfall for Broome and Kimberley coast. Tracking west/southwest. No direct threat to southeast Queensland.
31U, Gulf of Carpentaria
Gradual movement around the Gulf toward NT coast. Heavy rainfall for Gulf Country catchments already under flood pressure. Low risk for QLD coast.
Abstract
Four tropical lows are developing simultaneously across northern Australia on 4 March 2026, driven by a moderately strong Madden-Julian Oscillation (MJO) and a Rossby wave moving through the region. Of the four, only Tropical Low 29U poses a plausible direct threat to Queensland's east coast. It is 600 km northeast of Cairns, carrying 45% cyclone development probability by Friday, with landfall expected on the North Tropical Coast between Cooktown and Cardwell. The critical question for Dayboro, situated 45 km northwest of Brisbane in the D'Aguilar Range foothills, is what happens after landfall. The majority of numerical weather models track 29U inland over northern Queensland. A minority scenario, seen in some GFS and ECMWF runs, has it hugging the coast southward toward central and southeast Queensland. If that minority scenario plays out, Dayboro's orographic position amplifies rainfall substantially, as demonstrated last year when Tropical Cyclone Alfred produced approximately 505 mm at the Dayboro weather station during its passage through southeast Queensland in March 2025. The direct probability of impact on Dayboro from this week's systems is moderate at best. The indirect risk, saturated catchments, continued monsoon moisture, and a flood-prone river system, is real and quantifiable regardless of which scenario unfolds.
1. What Is Actually Happening Right Now
I have been watching this valley's weather for over two decades. I do not recall seeing four named tropical lows simultaneously active across northern Australia. That is what we are looking at on the morning of 4 March 2026.
The Bureau of Meteorology issued its Tropical Cyclone Advice at 4:41 pm AEST today. Tropical Low 29U is sitting at 14.4°S, 150.7°E, that is 600 km east-northeast of Cairns and 660 km northeast of Cardwell. It is slow moving. It is carrying sustained winds of 65 km/h and gusts to 95 km/h. A formal Watch zone has been issued for the stretch of coast from Cooktown to Palm Island, including Port Douglas, Cairns, and Innisfail.
BOM Official Position, 4:41 pm AEST, Wed 4 March 2026
"There is a moderate chance of Tropical Low 29U developing into a tropical cyclone before it makes landfall on the North Tropical Coast during Friday." Gales (100 km/h gusts) forecast between Port Douglas and Cardwell. Heavy rainfall north of Ingham on Thursday; possible extension south to Palm Island and adjacent inland areas on Friday.
The BOM's 7-day cyclone probability table paints a clear picture of the timing:
| Time (AEST) | 29U Cyclone Probability | Category |
|---|---|---|
| Wed 4 Mar, 10:00 pm | 15% | Low |
| Thu 5 Mar, 10:00 am | 35% | Moderate |
| Thu 5 Mar, 10:00 pm | 45% | Moderate |
| Fri 6 Mar, 10:00 am | 45% | Moderate |
| Fri 6 Mar, 10:00 pm | 15% | Low |
| Sat 7 Mar, 10:00 am | 5% | Low |
| Sat 7 Mar, 10:00 pm | <5% | Very Low |
The 45% peak probability window is Thursday night through Friday, the period when 29U is expected to be making landfall. After that, the probability drops sharply. Note that this is the probability of cyclone formation, not landfall at any particular location. BOM and ECMWF place formation probability slightly differently, BOM at 25–30%, ECMWF at around 40%. That discrepancy is not unusual for a system at this range; it reflects genuine uncertainty in the thermodynamic environment and the vertical wind shear as the system approaches the coast.
2. Why Four Lows at Once
Tropical lows do not appear from nowhere. They require three things: sea surface temperatures above 26°C to provide convective energy; low vertical wind shear so the developing vortex is not torn apart by competing winds at different altitudes; and a pre-existing atmospheric trigger to give the vortex its spin. This week, all three conditions are in place simultaneously across the entire northern Australian region.
2.1 The Madden-Julian Oscillation
The BOM's Tropical Climate Update, issued 3 March 2026, identifies a "moderately strong Madden-Julian Oscillation" as one of the key drivers. The MJO is a large-scale pulse of enhanced atmospheric convection that moves eastward around the tropics over a 30–60 day cycle. When it is in its active phase over the Australian region, which it currently is, it suppresses wind shear and enhances moisture at low levels, making tropical cyclone formation dramatically more likely [Bureau of Meteorology, 2026].
The IPCC AR6 assessment confirms that the MJO modulates tropical cyclone activity globally, with particularly strong effects on the Australian region during active phases [IPCC WGI Chapter 8, 2021]. We are in an active phase right now. That is why we have four systems instead of zero.
2.2 The Rossby Wave
The second driver is a Rossby wave, a large atmospheric wave that propagates westward through the tropics. BOM explicitly identifies this wave as contributing to the current activity period. Rossby waves create the low-level convergence and upper-level divergence that tropical systems need to deepen. They also modulate the distribution of atmospheric vorticity, essentially, they distribute the ingredients for cyclone spin across a wide region simultaneously. That is why 28U, 29U, 30U, and 31U have all appeared within the same week rather than sequentially.
2.3 Saturated Catchments, The Background Risk That Does Not Need a Cyclone
This is worth stating plainly. Even without a direct hit from any of these systems, Dayboro and the broader SEQ hinterland face elevated flood risk this week. The BOM's Tropical Climate Update confirms that during the week ending 2 March, western and south-western Queensland recorded 50–200 mm of rainfall. Major flood warnings are already active in catchments across western and north-eastern Queensland. The highest weekly total at a Bureau gauge was 371.2 mm at Gairloch in Queensland.
Those are upstream catchments. When they are already saturated, rainfall that would normally be absorbed by the soil instead runs directly to creeks and rivers. For the Pine and Caboolture river systems, both of which drain the D'Aguilar Range and both of which flow through or near Dayboro, saturated conditions mean the flood response to any rainfall is faster and higher than it would be after a dry period.
BOM on Dayboro's Flood Exposure
The Bureau of Meteorology's Pine and Caboolture River Flood Warning System documentation states explicitly: "Flash flooding occurs in both river systems along the small tributaries in the upper catchment, impacting towns such as Samford and Dayboro, but also in the middle reaches of the catchment."
3. The Dayboro Geography, Why the Range Amplifies Rainfall
Dayboro sits at approximately 26.8°S, 152.8°E, at an elevation of around 100–180 m above sea level in the foothills of the D'Aguilar Range. That might not sound like much. But the D'Aguilar escarpment rises abruptly to the west, Mt Glorious at 680 m and Mt Nebo at around 520–550 m are only 10–12 km away as the crow flies. Those ranges form a near-continuous barrier running north-northeast to south-southwest.
3.1 Orographic Uplift, The Mechanics
When a tropical system approaches SEQ from the Coral Sea, it carries deep tropical moisture in easterly to northeasterly low-level flow. That flow hits the D'Aguilar Range and has nowhere to go but up. As the moist air rises, it cools adiabatically, roughly 6–10°C per kilometre of ascent, and when it reaches its dewpoint, condensation produces intense convective rainfall. This is called orographic enhancement, and it is well-documented in the scientific literature for the Australian east coast [Katzfey and McInnes, 1996; IPCC AR6 WGI Chapter 10, 2021].
The practical consequence is that rainfall totals in the D'Aguilar Range and its immediate foothills, which includes Dayboro, routinely exceed coastal Brisbane totals during tropical events. The data from Tropical Cyclone Alfred in March 2025 illustrates this exactly.
3.2 The Alfred Data, What Actually Happened Here
Cyclone Alfred made landfall at Moreton Island at 23:30 AEST on 7 March 2025 [Bureau of Meteorology, 2025]. It was the first tropical cyclone to strike southeast Queensland in approximately 50 years, the last comparable event being Tropical Cyclone Zoe in 1974 [The Conversation, 2025]. For the broader SEQ region, the event produced 400–600 mm between 4 and 10 March. Brisbane City recorded its highest daily rainfall in 51 years: 275.2 mm in a single day. Three sites in the Gold Coast Hinterland exceeded 1,000 mm over 7 days.
At the Dayboro weather station, the event total was approximately 505 mm. At Mt Nebo on the D'Aguilar escarpment, 144 mm fell in just 6 hours. Mt Glorious recorded 142 mm in 6 hours. These are not outliers, they are orographic enhancement working exactly as the physics predicts.
| Location | Rainfall Total | Period | Note |
|---|---|---|---|
| Dayboro weather station | ~505 mm | Full Alfred event | Local hinterland foothills |
| Mt Nebo (D'Aguilar Range) | 144 mm | 6 hours | Orographic amplification |
| Mt Glorious (D'Aguilar Range) | 142 mm | 6 hours | Orographic amplification |
| Highvale (west of D'Aguilar) | 118 mm | 6 hours | Foothills western slope |
| Brisbane City | 275.2 mm | Single day record | Highest since 1974 |
| Gold Coast Hinterland (3 sites) | >1,000 mm | 7 days | Springbrook area |
| SEQ / NE NSW (broad area) | 200–400 mm | 4–10 March 2025 | Basin-wide totals |
The flooding consequences of those totals were significant. Major riverine flooding was recorded in the Lockyer, Laidley, and Warrill Creeks, and in the Bremer, Logan, and Albert Rivers. The North Pine River, which drains the D'Aguilar Range catchment through Dayboro, responded accordingly. Over 500,000 customers lost power across SEQ and northeastern New South Wales [Bureau of Meteorology, 2025; Guy Carpenter, 2025].
The Alfred event is not being raised here to cause alarm. It is being raised because it is the most recent and most complete dataset we have for what a tropical system tracking south to SEQ actually does to Dayboro. It is the benchmark. Any analysis that ignores Alfred is ignoring the most relevant piece of evidence we have.
4. What the Models Are Saying, and Where They Disagree
I want to be direct about what can and cannot be said from model data at this range.
At 600 km distance and 2–3 days from landfall, track forecasts for tropical systems in the Coral Sea carry substantial uncertainty. The Conversation's analysis of Alfred in 2025 noted that Coral Sea cyclones "experience the most unpredictable paths in the world" due to competing steering influences at multiple atmospheric levels [The Conversation, 2025]. That remains true for 29U today.
4.1 The Consensus, And the Minority Scenario
The current model consensus, represented by the ACCESS-G and most GFS ensemble members, tracks 29U onto the North Tropical Coast (somewhere between Cooktown and Townsville), then moves it inland over northern Queensland after landfall, where it decays in a northwest direction. Under this scenario, the direct impact on southeast Queensland would be limited to residual moisture and enhanced rainfall along the ranges, significant but not extreme.
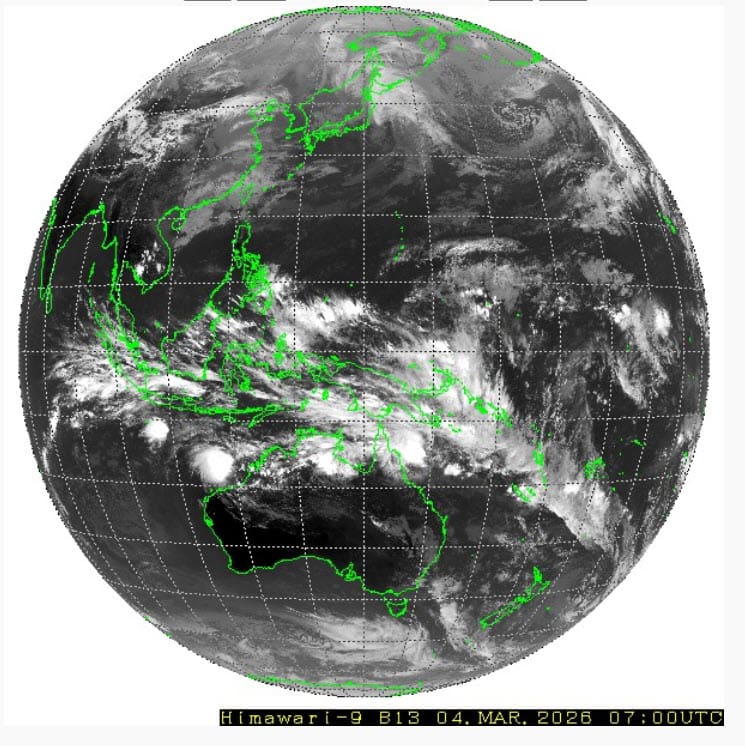
A minority scenario, evident in some GFS ensemble members and at least one ECMWF run, shows the system hugging the coast southward after landfall, reaching central and even southeast Queensland by the weekend. This is precisely the track that the BOM annotations on today's Himawari satellite image describe: "29U is expected to track parallel to the Qld coast from the Peninsula south towards the Capricorns. This leads to renewed coastal flood risk to large ports of the east coast."
The Model Split, What It Means in Practice
When BOM, GFS, and ECMWF disagree on post-landfall track, it means the atmosphere is at a bifurcation point, small differences in initial conditions produce very different outcomes. This is not a failure of the models; it is an honest reflection of the forecast uncertainty. In practical terms for Dayboro: the consensus scenario means residual heavy rainfall and elevated flood risk from saturated catchments. The minority scenario means an Alfred-scale event is not off the table.
Neither the media nor this analysis can resolve that model split. What can be said is that the minority scenario is physically plausible, it happened with Alfred in 2025, it happened with Cyclone Wanda in 1974, and that the conditions driving it (competing subtropical ridges, slow system movement, deep tropical moisture) are present this week.
5. The Alfred Analogue, Why Last Year Matters This Year
Alfred's southward track in 2025 was described as the first of its kind in approximately 50 years. That framing is accurate but potentially misleading. It was unusual in terms of recent history. It was not unprecedented in terms of the physics.
The mechanism that drove Alfred south is well understood. The system became locked between a high-pressure ridge over the Tasman Sea to the east and a subtropical ridge to the southwest. It could not move east and it could not move west, so it drifted south. An upper-level trough then provided the final steering push that turned it toward land [The Conversation, 2025]. CSIRO researchers subsequently noted that Alfred's slow movement, the factor most responsible for the extreme rainfall accumulation, may be consistent with a trend toward slower-moving tropical systems in a warming climate [CSIRO, 2025].
Those same steering conditions, blocking ridges, competing pressure systems, an active upper trough, are present in this week's synoptic pattern. The BOM's Tropical Climate Update confirms the subtropical ridge is a factor in the current system development. Whether the particular configuration required for a southward coastal track will materialise with 29U is not yet knowable at this range.
What is knowable is this: the last time these conditions combined in March in the Coral Sea, Dayboro recorded 505 mm. That number should be in the preparation calculus for anyone in this valley this week.
Devil's Advocate Review
Challenging the analysis above, where are the overstatements?
Challenge 1: The Alfred Comparison Is Being Overweighted
Alfred was genuinely exceptional, the first SEQ cyclone landfall in 50 years. Treating it as a representative precedent inflates the apparent probability of a repeat. The base rate of a tropical system tracking that far south is extremely low, perhaps once every generation. Using Alfred as "the benchmark" without stating that base rate clearly could cause readers to assign a probability higher than is justified by the climatological record.
Challenge 2: The Consensus Track Has 29U Staying North
The majority of numerical weather model guidance, the ACCESS-G consensus, most GFS members, tracks 29U into northern Queensland and has it decaying inland. The minority scenario that reaches SEQ represents a small fraction of the ensemble spread. The blog gives the minority scenario prominent treatment. A fair reading of the models should weight it accordingly: it is possible, but it is not the most likely outcome.
Challenge 3: 29U Is Currently Weak and May Not Even Develop
At the time of writing, 29U has sustained winds of only 65 km/h, barely tropical low intensity. The cyclone probability of 45% by Friday means there is a 55% chance it does not develop at all. A weaker system carries less moisture and produces less rainfall. An ex-tropical low that decays over the Queensland cape is a very different threat to SEQ than a Cat 2 cyclone tracking south.
Challenge 4: The Saturated Catchment Argument Works Both Ways
It is true that saturated catchments increase flood response to rainfall. It is also true that if upstream catchments are already in flood, the rivers are already doing the work. Flood risk does not simply double when catchments are wet, the relationship is nonlinear and depends on soil moisture deficits, dam storage, and current river levels at the time of any new rainfall event.
Rebuttal, Standing Firm on the Evidence
On Alfred as a Precedent
The Devil's Advocate is right that Alfred was a rare event. The base rate for an SEQ cyclone landfall is approximately once every 50 years, that is a fair statement. However, the probability of an Alfred-style event is not what this analysis is quantifying. It is quantifying the consequences if the minority track scenario unfolds, which requires only a southward coastal track for a system that does not need to remain a named cyclone to produce significant rainfall at Dayboro. A weakening tropical low hugging the coast southward would produce orographic enhancement over the D'Aguilar Range regardless of its intensity classification. Alfred is the closest analogue for the rainfall physics, not for the probability.
On Model Consensus
The analysis does not argue that the minority scenario is more likely. It argues that it is physically plausible and represents the scenario that determines preparation decisions for this valley. A risk assessment that only covers the most probable scenario is not useful for anyone making practical decisions about whether to clear creek crossings, move livestock, or prepare for flooding. The consensus track is the most likely outcome. The minority track is what to prepare for.
On 29U's Current Weakness
This is a valid challenge. A system that does not develop into a named cyclone will carry less destructive wind energy. However, the rainfall risk is not primarily a function of wind speed, it is a function of moisture content, system speed, and orographic position. Alfred produced its worst rainfall after it was downgraded to a tropical low over southeast Queensland. Intensity classification is less important than the question of track and speed.
On Saturated Catchments
Correct, the relationship is nonlinear and this analysis does not attempt to quantify it precisely. The point stands that elevated antecedent soil moisture lowers the rainfall threshold for flash flooding in the Pine River upper catchment, and that threshold is already reduced relative to a dry period. The BOM document confirms Dayboro's specific flash flood exposure from the upper Pine catchment. That risk is elevated this week regardless of what 29U does.
6. The Probability Assessment, What Dayboro Should Actually Expect
Let me be direct about what the evidence supports and what it does not.
| Scenario | Probability | Dayboro Impact |
|---|---|---|
| 29U makes landfall NQ, tracks northwest, decays inland | Most likely (~60–65%) | Residual heavy rainfall D'Aguilar Range. Elevated but not extreme flood risk. Existing upstream flooding continues. |
| 29U does not develop into cyclone, weakens before landfall as tropical low | Moderate (~20–25%) | Reduced rainfall from weaker system. Some heavy falls still possible from monsoon moisture. Lower direct risk. |
| 29U (or remnant low) tracks south parallel to coast, reaches central/SEQ | Minority (~10–20%) | Alfred-scale event possible. Orographic enhancement D'Aguilar Range. North Pine River flash flooding. 300–600 mm totals at Dayboro within 48–72 hours plausible. |
The honest summary is this: Dayboro is not in the crosshairs this week on the balance of probabilities. The track consensus has 29U staying well north. But the conditions are the most active tropical setup I have seen in this region since Alfred last year, the minority scenario is not fringe physics, and the catchments are wet. If the track shifts south, and model disagreement this week is real, the impact would be significant.
Check BOM's warnings page daily for updates. The critical decision point will be Thursday, by then, the track uncertainty for 29U should narrow substantially. If the coastal southward scenario is still in play on Thursday afternoon, that is when preparation matters.
Live Resources, Check These Daily
BOM Queensland Warnings Summary · BOM Tropical Cyclone 7-Day Forecast · BOM Queensland Flood Warnings · GFS Model, Australia MSLP & Rainfall
References
- Bureau of Meteorology. (2026, March 4). Tropical Cyclone Advice, Tropical Low 29U, Watch Cooktown to Palm Island. Issued 4:41 pm AEST. Commonwealth of Australia. bom.gov.au/warning/tropical-cyclone-advice/IDQ20023
- Bureau of Meteorology. (2026, March 4). Tropical Cyclone 7-Day Forecast. Commonwealth of Australia. bom.gov.au/cyclone/7dayforecast
- Bureau of Meteorology. (2026, March 3). Tropical Climate Update. Commonwealth of Australia. bom.gov.au/climate/tropical-note
- Bureau of Meteorology. (2025). Severe Tropical Cyclone Alfred (22U). Post-event summary. Commonwealth of Australia. bom.gov.au/cyclone/history/Alfred2025.shtml
- Bureau of Meteorology. (n.d.). Pine and Caboolture River Flood Warning System. Commonwealth of Australia. bom.gov.au/qld/flood/brochures/caboolture
- Guy Carpenter. (2025, March). Post-Event Report: 2025 Australian Region Tropical Cyclone Alfred. Guy Carpenter & Company. guycarp.com
- CSIRO. (2025, March). Climate Change and Cyclone Alfred. Commonwealth Scientific and Industrial Research Organisation. csiro.au
- The Conversation. (2025, March). Cyclone Alfred is expected to hit southeast Queensland, the first in 50 years to strike so far south. theconversation.com
- IPCC. (2021). Climate Change 2021: The Physical Science Basis. Working Group I Contribution to the Sixth Assessment Report, Chapter 8: Water Cycle Changes. Cambridge University Press.
- IPCC. (2021). Climate Change 2021: The Physical Science Basis. Working Group I Contribution to the Sixth Assessment Report, Chapter 10: Linking Global to Regional Climate Change. Cambridge University Press.
- Katzfey, J., & McInnes, K. L. (1996). GCM simulations of eastern Australian cutoff lows. Journal of Climate, 9(10), 2337–2355.
- Knutson, T., Camargo, S. J., Chan, J. C. L., Emanuel, K., Ho, C. H., Kossin, J., … & Wu, L. (2020). Tropical cyclones and climate change assessment: Part I: Detection and attribution. Bulletin of the American Meteorological Society, 101(3), E303–E322.
- Australian Journal of Emergency Management. (2023, October). Preparing for the Expected: Tropical Cyclones in South East Queensland. Australian Institute for Disaster Resilience. knowledge.aidr.org.au
- Weatherzone. (2026, March 4). Tropical cyclone risk increasing near Australia this week. weatherzone.com.au
Four Tropical Lows: What Does This Mean for Dayboro?
A scientific analysis of the current tropical activity, and an honest assessment of the probability any of it reaches the D'Aguilar foothills.
29U, Coral Sea
600 km ENE of Cairns. Watch issued. The only system with direct Queensland relevance this week.
28U, Indian Ocean
Fujiwhara interaction with 30U expected. Not forecast to affect Australian mainland.
30U, Kimberley
Heavy rainfall Broome. Tracking west/southwest. No SEQ threat.
31U, Gulf of Carpentaria
Moving toward NT coast. Heavy rainfall Gulf Country catchments already flooded.
Abstract
Four tropical lows are active simultaneously across northern Australia today, driven by a moderately strong Madden-Julian Oscillation and a Rossby wave moving through the region. Only 29U poses a plausible direct threat to Queensland's east coast. The critical question for Dayboro, in the D'Aguilar Range foothills, 45 km northwest of Brisbane, is what happens after 29U makes landfall Friday. The majority model track takes it inland over northern Queensland. A minority scenario has it hugging the coast south toward central and southeast Queensland. If that minority scenario plays out, Dayboro's orographic position amplifies rainfall substantially, exactly as it did when Cyclone Alfred produced approximately 505 mm at the Dayboro weather station during March 2025.
1. What Is Actually Happening Right Now
I have been watching this valley's weather for over two decades. I do not recall seeing four named tropical lows simultaneously active across northern Australia. That is what we are looking at on the morning of 4 March 2026. BOM issued its formal cyclone advice at 4:41 pm AEST today. 29U is at 14.4°S, 150.7°E, 600 km ENE of Cairns, carrying sustained winds of 65 km/h, gusts to 95 km/h, and a formal Watch zone from Cooktown to Palm Island. There is a moderate chance it becomes a named cyclone before landfall Friday.
What the full analysis covers (members only):
- What Is Actually Happening Right Now, live BOM data as of 4:41 pm AEST
- Why four lows at once, MJO, Rossby wave, sea surface temperatures explained
- The Dayboro Geography, why the D'Aguilar Range amplifies rainfall from tropical systems
- What the Models Are Saying, GFS, ECMWF, ACCESS-G consensus and minority scenario
- The Alfred Analogue, March 2025, 505 mm at Dayboro, what it means for this week
- The Probability Assessment, three scenarios, honest probability ranges, what to prepare for
- Devil's Advocate Review, where this analysis could be wrong
- Rebuttal, evidence for and against each challenge
- 14 verified references including BOM, CSIRO, IPCC, and peer-reviewed literature
The BOM's Tropical Climate Update confirms above-average rainfall is likely across northern Australia for the fortnight of 7–20 March. The increased tropical activity is being driven by two reinforcing large-scale atmospheric modes: a moderately strong Madden-Julian Oscillation and a westward-propagating Rossby wave. When both are active simultaneously, the conditions for simultaneous cyclone development across the northern Australian region improve dramatically. The last time conditions were this active, Cyclone Alfred produced record-breaking rainfall across southeast Queensland...
Read the full scientific analysis
The complete paper includes model comparisons, the Alfred 2025 rainfall data for the D'Aguilar Range, the Devil's Advocate review, and the full probability assessment for each scenario, including the minority track that would put Dayboro in the firing line.
Become a Member, 7 Days FreeMost people stay. No spam, cancel anytime.
Get Dayboro weather delivered to your inbox every morning — forecasts, garden tips, and local updates. Subscribe free →