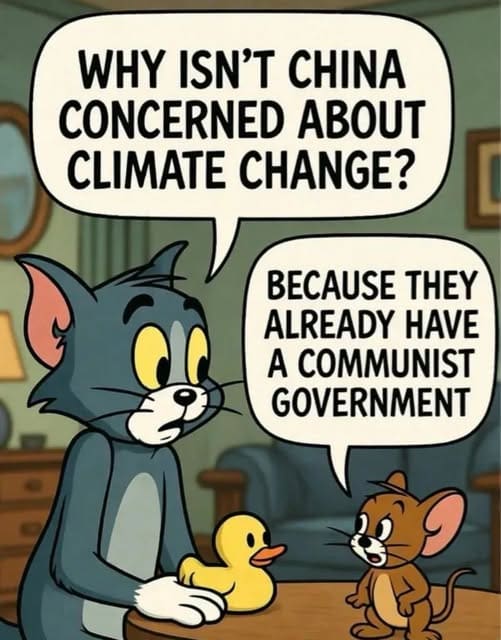
I was on a facebook page of a chap I highly respect. Green Gregs. He posted this image, and I replied
“Probably because they have over 4000 years of detailed weather records and know it is cycles. It has nothing to do with humans and even less to do with CO2.”
Which got met with a question from another poster.
“It is true that there are natural climate changes. Each change is due to well defined natural forces.
So I figured, a this question comes up and when I was working with Lee Wheelbarger this was discussed. So let dive wright in.
Please tell us which natural forces are growing in intensity to create the current warming.
Natural climate cycles: what’s real, what’s not, and what I’d say to a mate at the fence
I get asked this one a lot, usually after a hot week, a muggy night, or a wild run of “that’s not normal” weather.
“There are natural climate changes. Each change is due to well defined natural forces. Which natural forces are growing in intensity to create the current warming?”
It’s a fair question, and a useful one, because it forces us to separate natural climate variability from long-term climate change. The short answer is that most natural forces don’t steadily “grow” in intensity. They operate in cycles, shifting heat around the climate system over years, decades, and centuries.
Right now, several of those cycles are aligned in ways that amplify short-term warming, even though they don’t fully explain the long-term trend on their own.
This article walks through the main natural drivers, what they genuinely explain, and where their limits lie.
1. Ocean Oscillations: PDO and AMO
Two of the most important natural drivers are large-scale ocean circulation patterns:
Pacific Decadal Oscillation (PDO)
Atlantic Multidecadal Oscillation / Variability (AMO / AMV)
What they are
The PDO is a long-lived pattern of Pacific Ocean temperature and atmospheric circulation that tends to flip phase every 20–30 years.
The AMO describes multidecadal swings in North Atlantic sea surface temperatures, typically on 60–80 year timescales.
These oscillations do not add energy to the Earth system. Instead, they redistribute heat between the deep ocean and the atmosphere.
What they explain well
Faster warming periods (e.g., 1910–1940, 1970–2000)
Slower warming or temporary cooling periods (e.g., 1940–1970)
Strong regional effects on rainfall, drought, and storm patterns
When both the PDO and AMO are in warm phases, global surface temperatures tend to rise more quickly. When one or both shift cool, surface warming can stall even if background forcing continues.
What they don’t do
These oscillations cannot create sustained, century-scale warming on their own. They shift where heat appears, not how much energy the planet gains overall.
That’s why climate models treat them as internal variability, powerful, real, and influential on short-to-medium timescales, but not the main driver of long-term trends.
2. Solar Activity and the Cosmic Ray Hypothesis
The Sun is an obvious natural influence, operating most visibly through its ~11-year solar cycle.
Solar Cycle 25
Solar Cycle 25 reached its maximum phase around late 2024
Solar activity during maxima is higher than during minima
Higher solar activity slightly increases incoming solar energy and strengthens the Sun’s magnetic field.
Cosmic rays and cloud cover
Research led by Henrik Svensmark has explored whether changes in solar magnetic activity affect cosmic ray flux, which in turn may influence cloud formation.
The proposed mechanism is:
Strong solar magnetic field → fewer cosmic rays reach Earth
Fewer cosmic rays → fewer cloud condensation nuclei
Fewer low clouds → slightly more surface warming
Laboratory and observational studies have demonstrated parts of this mechanism, and the idea remains an active research topic.
What the evidence supports
Solar variability does influence climate
The cosmic ray–cloud mechanism is physically plausible and supported by experimental work
What the evidence does not support
Solar variability alone does not explain the magnitude or persistence of modern warming
Satellite observations show that recent warming does not track solar output closely enough for the Sun to be the dominant driver
Solar cycles contribute short-term variability, not a steadily increasing trend.
3. Recovery from the Little Ice Age
The Little Ice Age (LIA) was a period of cooler global conditions, most prominent between roughly 1300 and 1850, particularly in the Northern Hemisphere.
It coincided with:
Reduced solar activity (e.g., the Maunder Minimum)
A high frequency of large volcanic eruptions
Internal climate variability
What matters today
As the climate emerged from the Little Ice Age, some warming was expected naturally. This helps explain part of the early warming observed in the 19th century.
However, a simple “rebound to normal” explanation has limits:
It does not provide a mechanism for continued warming over many decades
It does not explain the accumulation of heat in the oceans
It does not explain why warming accelerates during periods when natural drivers should be neutral or cooling
The Little Ice Age provides historical context, not a full explanation for modern trends.
4. Long Climate Records and Historical Warm Periods
Long-term climate variability did not begin with industry. Civilisations have documented warm and cold periods for millennia.
China’s historical records
China maintains one of the world’s richest continuous climate archives, including records of:
Floods and droughts
Freeze events
Crop yields
Seasonal timing
These records show repeated warm and cool periods linked to solar variability, volcanism, and circulation changes.
Some historical periods were regionally warm, while others were markedly cold, including during the Little Ice Age.
Important limitation
Historical warm periods were often regional, seasonal, or episodic. They do not represent globally synchronous warming of the magnitude seen today.
They demonstrate that natural variability is real, not that it explains all modern warming.
The CO₂ Question and Mid-Century Cooling
A common argument is:
“If CO₂ drives warming, temperatures should rise smoothly, but they cooled from about 1940 to 1970.”
The observation is correct. The conclusion is not.
What happened mid-century
Industrial aerosol pollution increased rapidly after WWII
Aerosols reflect sunlight and cool the surface
Ocean circulation shifted heat into deeper layers
These effects temporarily offset greenhouse warming, producing a mid-century slowdown.
Why this doesn’t refute greenhouse warming
CO₂ forcing does not produce a perfectly smooth temperature rise
Short-term variability can mask long-term trends
Once aerosol pollution was reduced, warming resumed
Natural cycles explain why warming pauses. They do not eliminate the underlying forcing.
So Which Natural Forces Are “Growing” Right Now?
Strictly speaking, none of the major natural drivers show a steady, long-term increase in intensity comparable to greenhouse gas forcing.
What we do see is:
Phase alignment of ocean oscillations that enhances short-term warming
Solar maximum conditions adding a small upward nudge
Internal variability temporarily boosting surface temperatures
These factors help explain why warming feels intense right now, without being the primary cause of the long-term trend.
| Natural Force | Typical Timescale | Current State | What It Explains |
|---|---|---|---|
| PDO | ~20–30 years | Cool phase since ~2007 | Regional climate shifts, warming slowdowns |
| AMO / AMV | ~60–80 years | Warm phase since ~1990s | Multidecadal temperature swings |
| Solar Cycle | ~11 years | Recent maximum (2024) | Short-term variability |
| Volcanism | Episodic | Currently quiet | Temporary cooling |
| Little Ice Age context | Multi-century | Past event | Early warming context |
Final Takeaway
Natural climate forces are real, powerful, and essential for understanding short-term climate behaviour. They explain why warming is uneven, why some decades rise faster than others, and why regional impacts vary so much.
What they don’t do, on their own, is create a sustained, global increase in the Earth’s total heat content over many decades.
The most accurate picture is not “natural vs human”, but natural variability operating on top of a long-term background shift.
Understanding both is the only way to make sense of what we’re seeing now.
Position statement:
I do not accept that human greenhouse gas emissions are the primary driver of current climate change. The evidence shows natural variability is sufficient to explain observed patterns without invoking dominant human causation. (Doc)
Get Dayboro weather delivered to your inbox every morning — forecasts, garden tips, and local updates. Subscribe free →