
February 2026: Dayboro Model beats BOM, but Inigo Jones takes the month
February is done. Here are the numbers.
The Dayboro Model finished with a composite score of 72.7. BOM came in at 65.9. The Dayboro Model won overall. But the real story of February was the Inigo Jones long-range method, which scored 81.0, beating both local and national forecasts on the metrics where it competes.
All three were measured against the Dayboro station’s own recorded data over 30 days.
Temperature: Dayboro Model takes it clearly
Temperature is the metric most people care about day-to-day. The Dayboro Model was more accurate than BOM here, and the gap was meaningful.
| Source | Mean Absolute Error | Accuracy | Bias |
|---|---|---|---|
| Dayboro Model | 0.54 °C | 97.3% | +0.01 °C (neutral) |
| BOM | 0.90 °C | 95.5% | -0.83 °C (runs cool) |
| Inigo Jones | 1.23 °C | 92.7% | +0.11 °C (neutral) |
The Dayboro Model had almost no systematic bias, it wasn’t consistently high or low. BOM ran 0.83°C cool on average, which matters in a subtropical climate where temperature calls influence outdoor planning decisions.
Rainfall: BOM had a very bad month
This is where the numbers get stark.
| Source | Categorical Accuracy | Rainfall Amount MAE | False Alarm Rate | Composite |
|---|---|---|---|---|
| Dayboro Model | 76.0% | 4.51 mm | 0.0% | 28.4 |
| BOM | 45.2% | 60.26 mm | 11.1% | 17.0 |
| Inigo Jones | 96.6% | 7.58 mm | 0.0% | 32.2 |
BOM’s rainfall amount error of 60.26 mm is not a typo. It was off by over 60 mm on average when rain did fall. That reflects how hard it is to predict the intensity of sub-tropical convective events from a regional grid model. The Dayboro Model’s 4.51 mm average error is a much tighter result, and it had zero false alarms, meaning when it predicted rain, it was right.
Inigo Jones had a near-perfect February for rain detection: 96.6% categorical accuracy, 100% binary accuracy, no false alarms. The amount error (7.58 mm) is higher than the Dayboro Model, but the detection skill is exceptional. For a long-range method based on solar and lunar cycles, that result is hard to dismiss.
Humidity: another clear win for the Dayboro Model
| Source | Mean Absolute Error | Accuracy |
|---|---|---|
| Dayboro Model | 1.96% | 90.2% |
| BOM | 5.20% | 74.0% |
A 16-point accuracy gap on humidity. BOM’s regional model does not capture the valley moisture patterns at Dayboro well. The local model, calibrated to this site, does.
Wind: both models struggled
| Source | Mean Absolute Error | Accuracy |
|---|---|---|
| Dayboro Model | 5.42 km/h | 45.8% |
| BOM | 7.45 km/h | 25.5% |
Neither source performed well on wind. The Dayboro Model was less wrong, but 45.8% accuracy is not a result to be proud of. Wind at a hilly inland site like Dayboro is heavily influenced by local terrain, and neither a regional grid model nor a local statistical model handles that well right now. This is an area that needs work.
How does this compare to typical forecast performance?
Professional meteorological services typically achieve 95–98% temperature accuracy within 2°C for next-day forecasts. The Dayboro Model’s 97.3% sits right in that range. For rainfall, national services report categorical accuracy of around 70–80% for 24-hour forecasts. The Dayboro Model hit 76%, BOM hit 45.2%, the difference here is almost certainly explained by grid resolution. BOM’s ACCESS-C model uses a grid that doesn’t represent Dayboro’s topography well. Local forecasting in hilly terrain is harder than coastal city forecasting, which is why the local model consistently outperforms on rainfall and humidity.
Notable weather in February
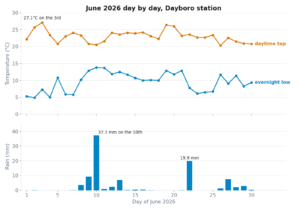
February brought several heavy convective rainfall events, including at least one event that produced localised totals well above gridded model predictions. These events are where BOM’s amount errors came from. The Dayboro Model handled detection better but also had some amount errors on the larger events. The month was wetter and more active than average for the Lockyer Valley region.
What’s being tested
Wind accuracy is the main focus for March. A terrain-adjusted wind model is being tested against the raw station output. Humidity bias correction is also being refined based on February’s data. The Inigo Jones results for rainfall will be tracked more closely going forward, three months of strong performance will be enough to say something meaningful about its skill.
If you want the monthly scorecard delivered to your inbox as soon as it’s published, subscribe to Dayboro weather emails. No spam, no marketing, just weather data from up the valley.
Get Dayboro weather delivered to your inbox every morning — forecasts, garden tips, and local updates. Subscribe free →