This chapter covers the forecasts on dayboro.au, from tomorrow out to a few years ahead. Every forecast here is our own, built for the Dayboro valley. Visitors can see a part of each one. Members see all of it, and we point out the difference as we go.
The forecast on the home page
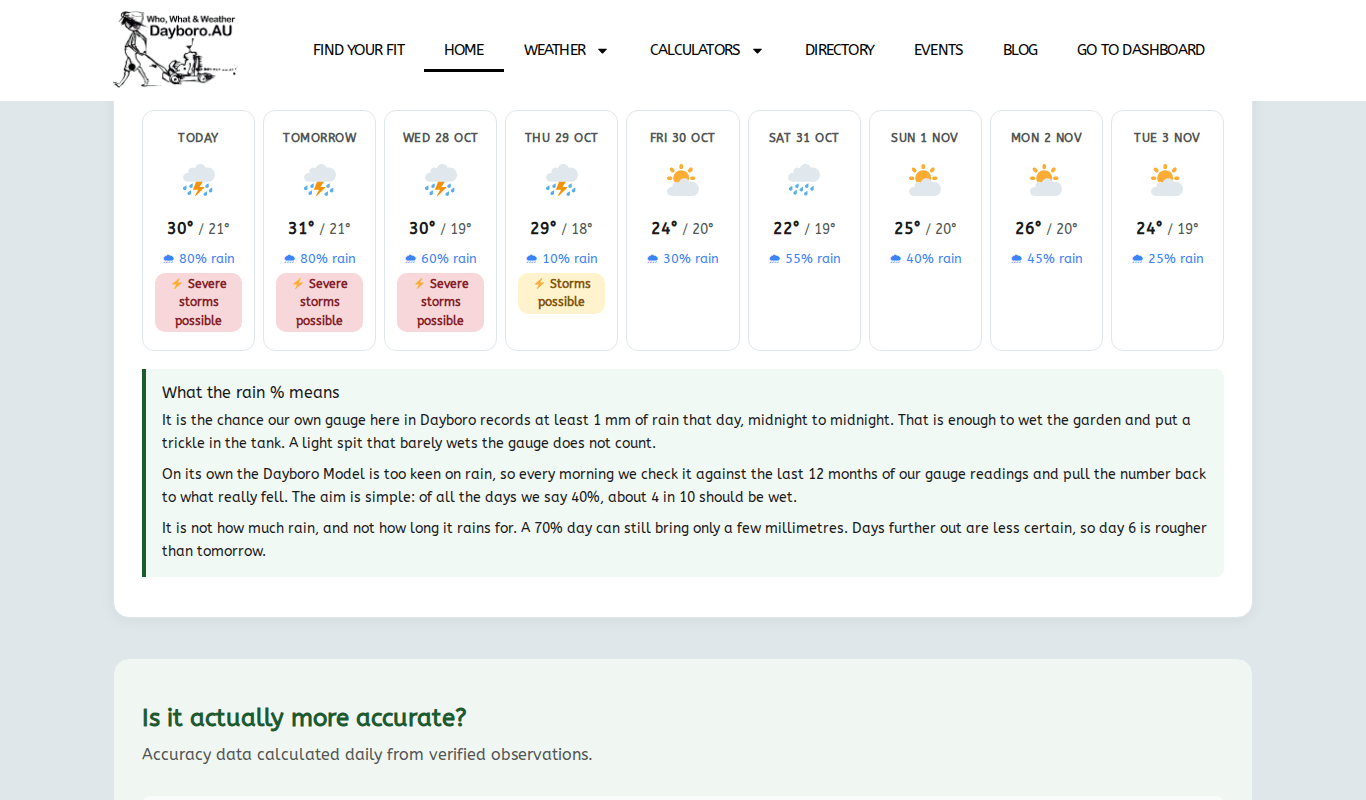
The quickest look at the weather ahead is on the home page. Visitors see the next 3 days. Members see 9 days.
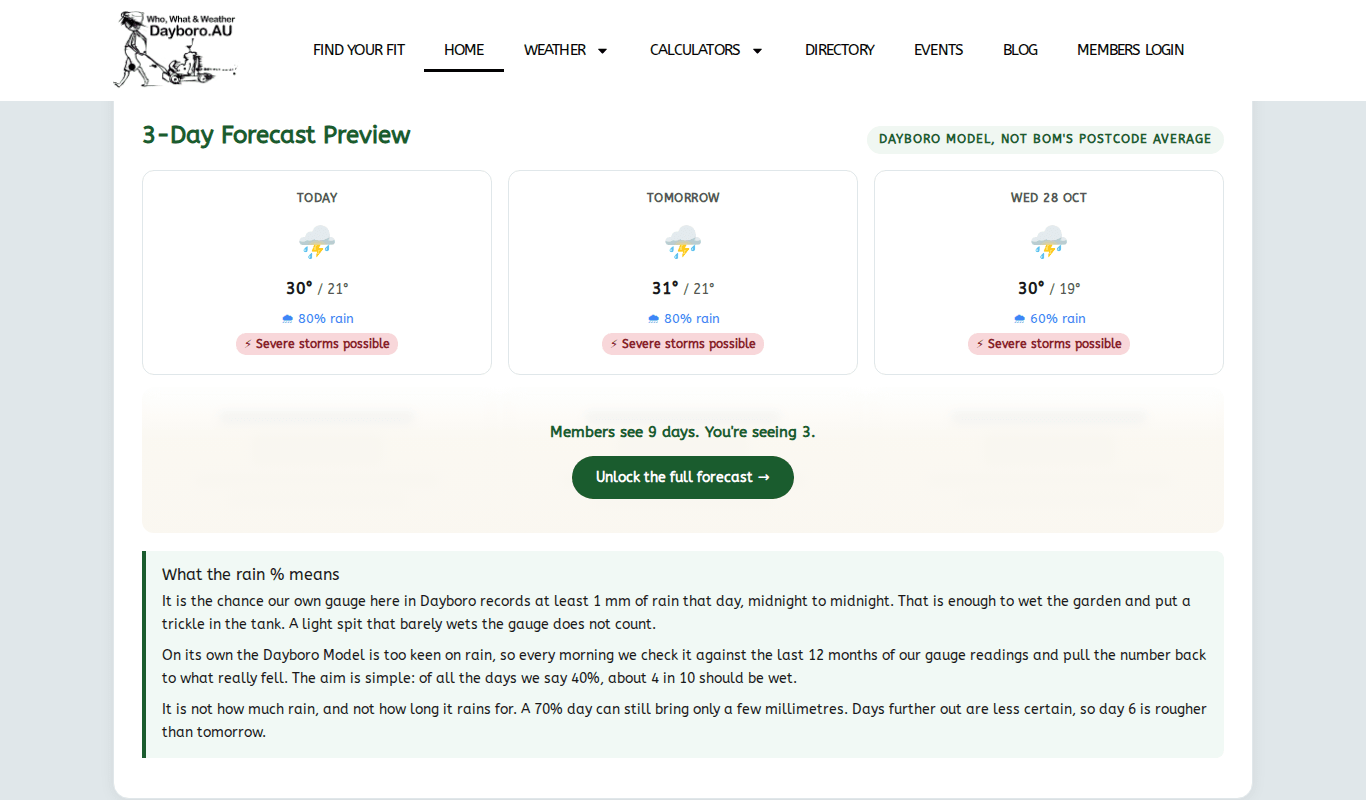
Each day is a card. Here is how to read one:
- Day name at the top.
- Icon for the kind of day: sun, cloud, rain, storm, fog or wind.
- Max and min temperatures, highest first.
- Rain %, the chance of rain that day.
- Storm badge, only on days with a storm risk. It reads, for example, “Storms possible” or “Severe storms possible”.
The icon follows the storm badge. If a day carries a storm badge, it gets the storm icon. Otherwise a day over 50% rain gets a rain icon, and a day over 25% gets a cloud icon.
What the rain % means
The rain % is the chance that our gauge records at least 1 mm of rain that day, midnight to midnight. A light spit does not count. On its own, the Dayboro Model is a bit too keen on rain. So every morning we check it against the last 12 months of gauge readings and pull the number back to what really happened.
Well, a 40% day does not mean it rains 40% of the day. It means that of all the days we call 40%, about 4 in 10 should turn out wet. It also does not tell you how much will fall. A 70% day can still bring only a few millimetres. Days further out are less certain, so day 6 is rougher than tomorrow.
The 7 day forecast
The 7 day forecast breaks each day into a day card and a night card. The page says the forecast is made every 4 hours or so. Each card shows the high or low, a short description, the chance of rain with the expected millimetres, and the wind.
Visitors see the first 2 days. The rest of the week shows as locked cards.
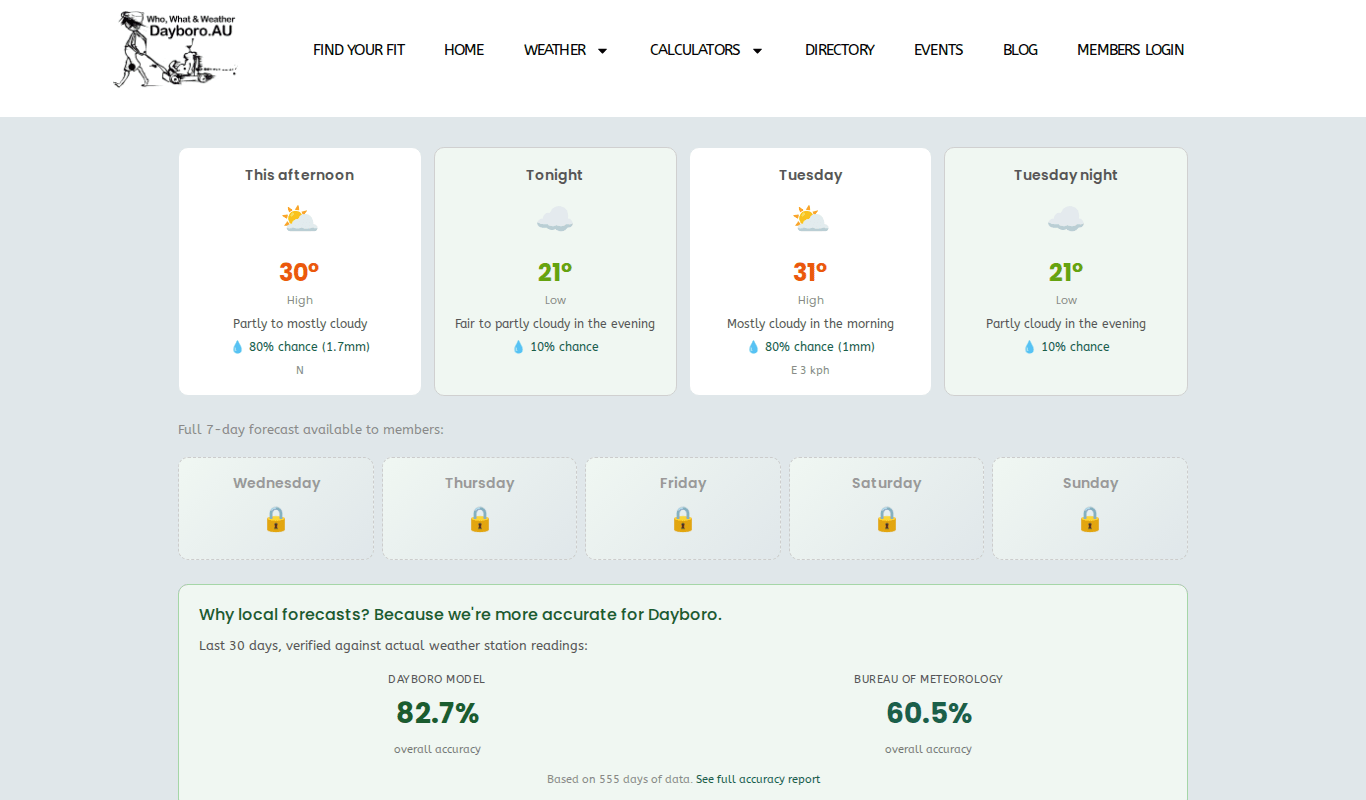
Members see all 7 days and nights. Their cards also show the UV index and the wind range, and the page shows when it was last updated. At the bottom there are links to the 30 day forecast, the accuracy report, the Weather Hub and the Farmers Almanac.
The 30 day forecast
The 30 day forecast is mostly for members.
Visitors get a preview. It shows a table for the next 3 days, plus weekly outlooks for week 1 and week 2. Each week shows a temperature range, the average rain chance and a one line summary. Weeks 3 and 4 and the climate driver readings are locked.
Members see a much longer page. It has:
- A day by day table for the next 30 days, with weather, rain chance, temperature range and key indicators.
- A monthly timeline for the next 12 months.
- A running seasonal outlook, with flood, storm and heat risk for each season.
- A 5 year outlook, and the climate cycles and ocean readings behind it.
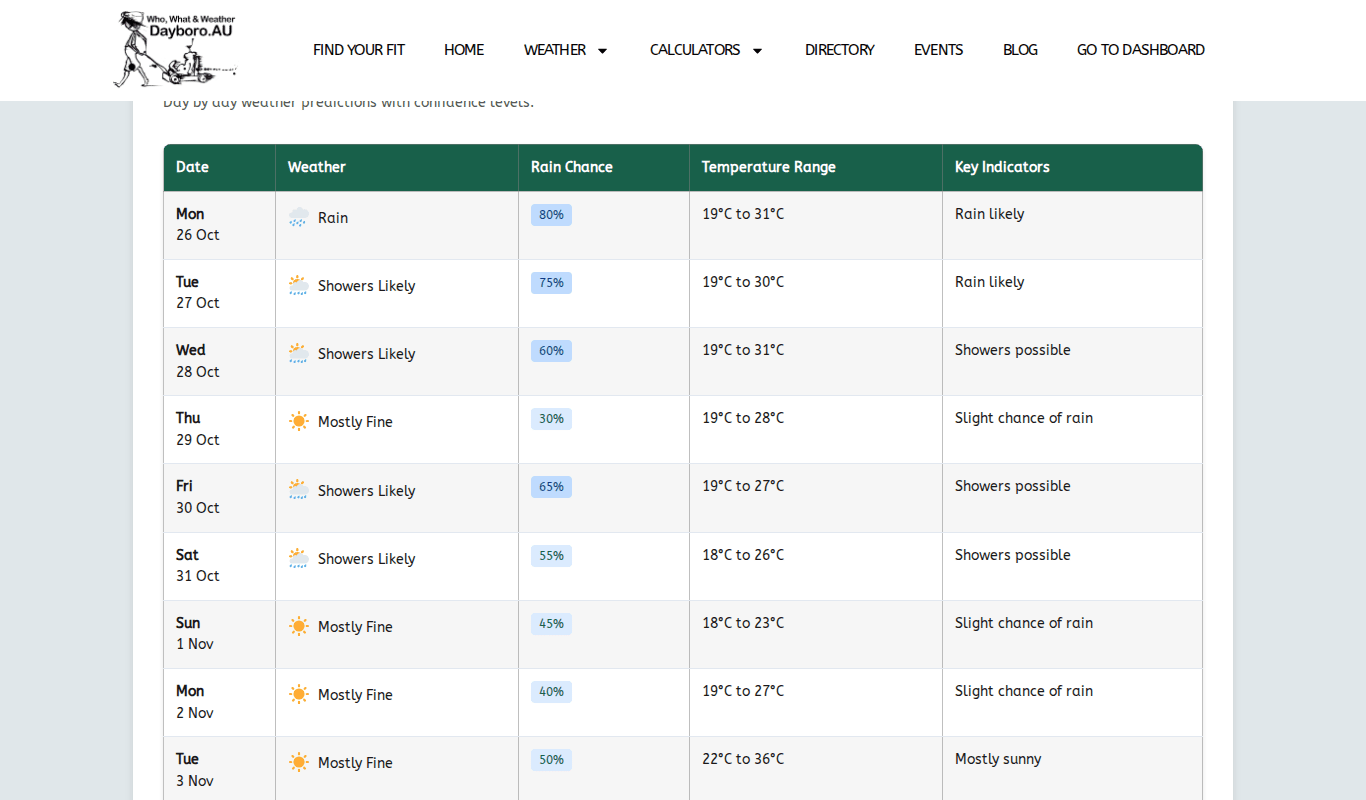
Use the first week or so of this table for planning. Further out, read it as a general lean, not a date to count on. Chapter 4 explains how the long range side works.
Forecasts for the rest of Australia
Two pages look past the valley.
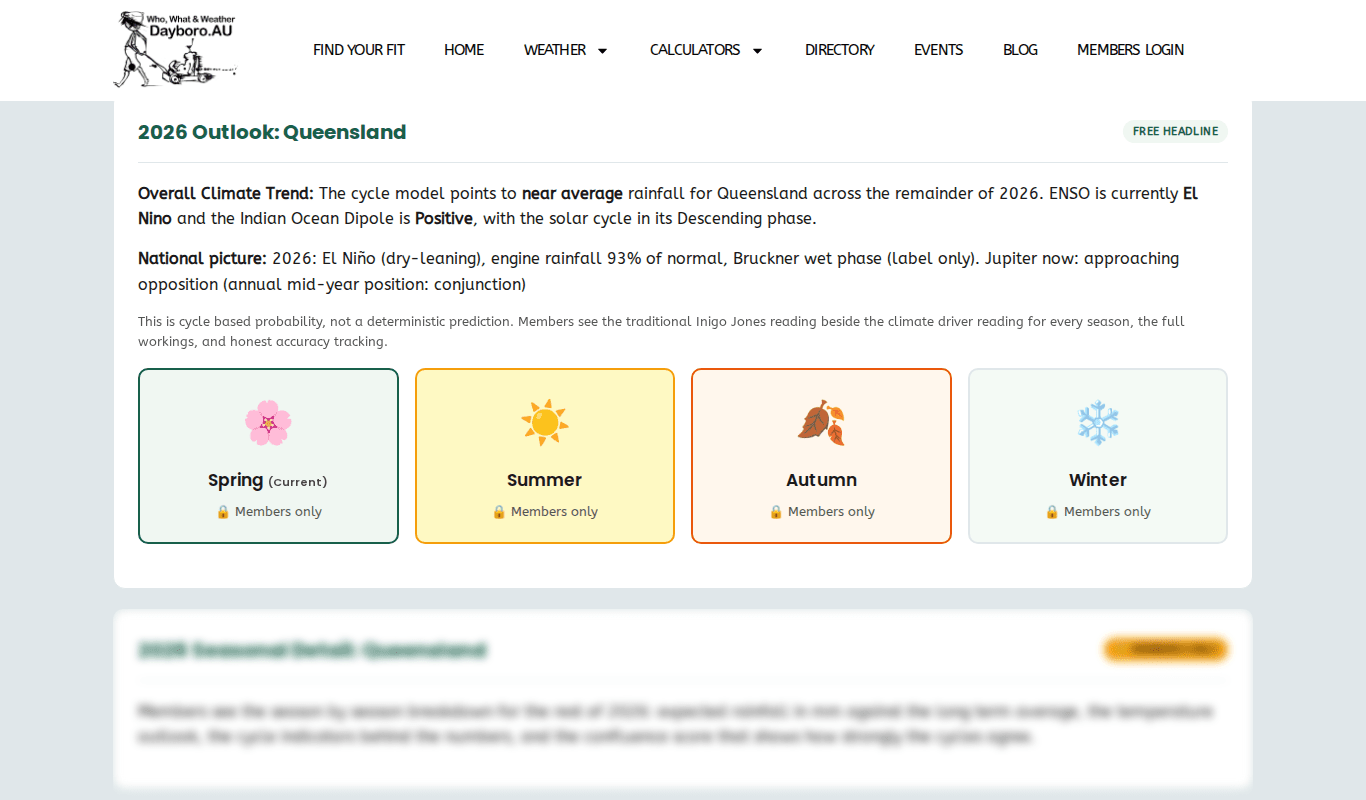
The Australian 5-Year forecast is updated weekly, every Sunday morning. Pick a state and you get a free headline for the rest of the year. The page says plainly that this is “cycle based probability, not a deterministic prediction”. The season by season detail and the outlook to 2030 are for members.
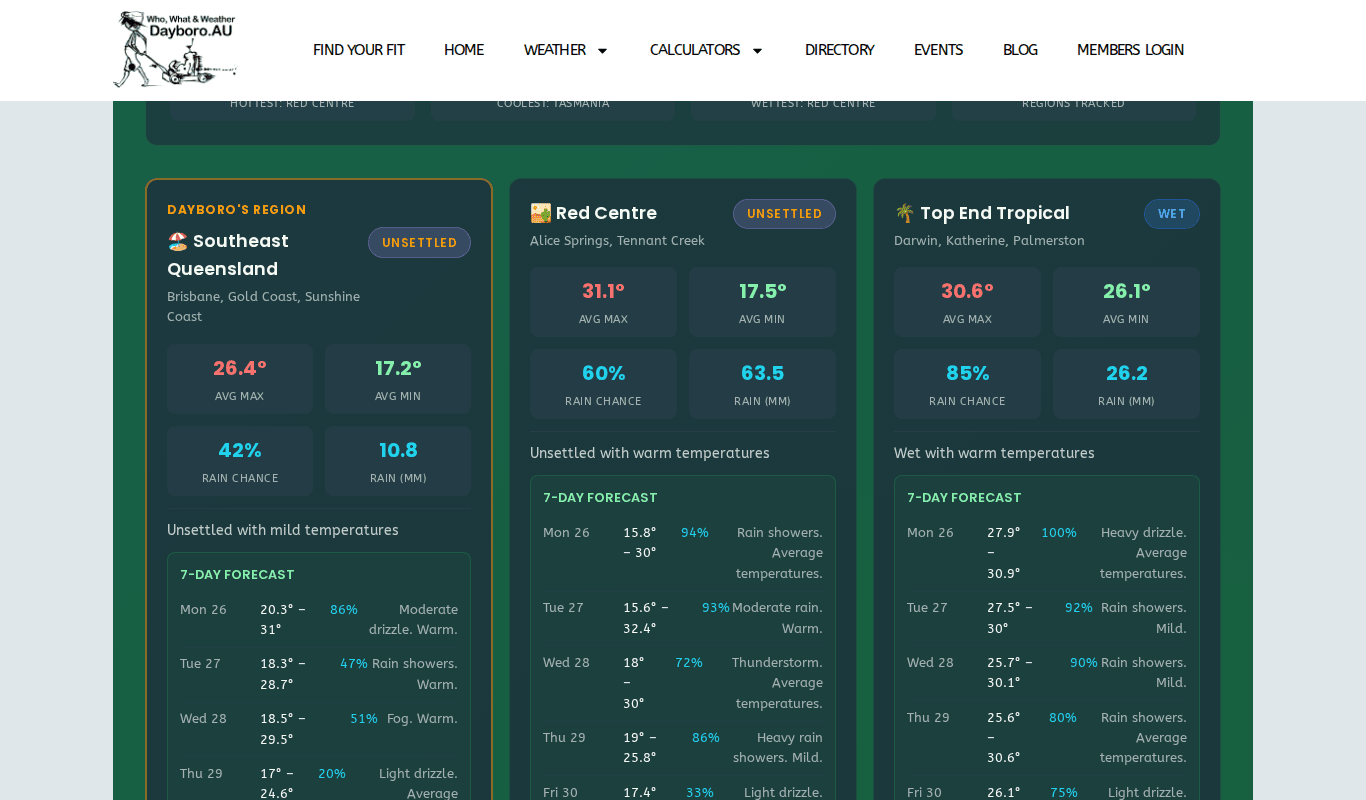
The Australian Regional Forecast is free for everyone. It is updated daily at 4:15am. Our own region, Southeast Queensland, comes first. Each region shows an average high and low, the rain chance and expected rain, and a short list of the coming days.
How accurate are the forecasts?
We check our forecasts against what our station actually records, and we print the results. The Forecast Accuracy page is open to everyone. On this moment it compares 555 days of forecasts from three sources.
| Measure | Dayboro.au | BOM | Inigo Jones |
|---|---|---|---|
| Temperature (average miss) | 0.6°C | 1.0°C | 2.2°C |
| Rain detection | 83.6% | 55.4% | 61.4% |
| Wind speed (average miss) | 1.6 km/h | 4.6 km/h | not given |
| Humidity (average miss) | 3.1% | 7.0% | not given |
| UV index (average miss) | 2.6 | 2.9 | not given |
| Overall accuracy | 82.7% | 60.5% | 50.4% |
These are the figures on the day we wrote this guide. The page updates itself, so check it for the latest. Lower is better for the “average miss” rows. Higher is better for rain detection and overall accuracy.
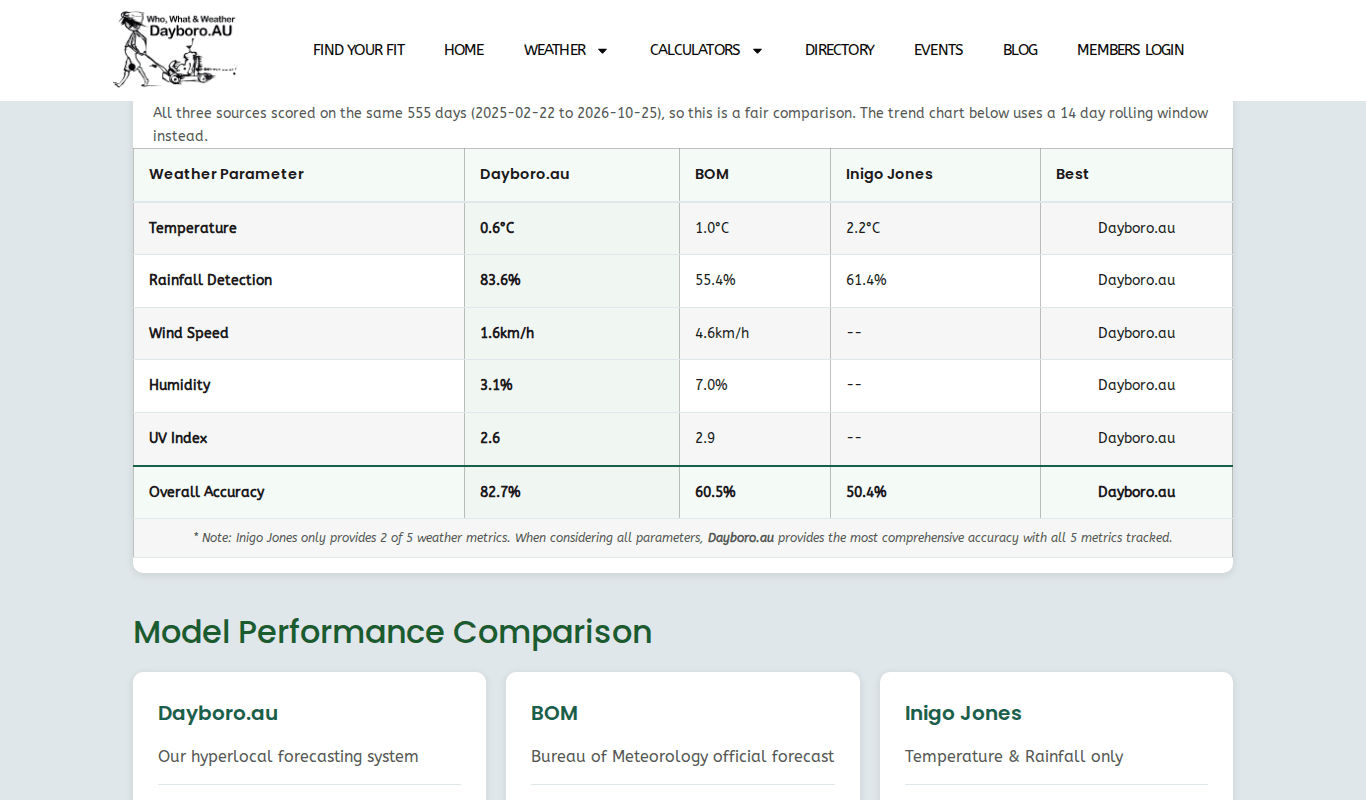
The overall score weights temperature most, then rain, then wind, then UV and humidity. A day counts as a rain day from 0.5 mm. The Inigo Jones forecast only covers temperature and rain, so it is scored on those two. The trend chart further down uses a 14 day rolling window.
The solar forecast page
The solar forecast page is opened from the link in your email. If you open it any other way, it shows “Unable to load forecast” and points you to the Solar Calculator to set up your system. Chapter 7 covers the calculators and chapter 8 covers the emails.
Quick steps: plan your week
- Open the home page for a quick look at the days ahead.
- Check the storm badges. Any badge means it is worth a closer look.
- Open the 7 day forecast for day and night detail, rain amounts and wind.
- For the weeks after that, look at the 30 day forecast.
- If you want the full week and month, see the membership levels.
Back to the guide contents. Next, chapter 4 covers long range forecasts and the Farmers Almanac.
The Dayboro team
Get Dayboro weather delivered to your inbox every morning: forecasts, garden tips, and local updates. Subscribe free →