From Dry Winters to Wet Springs: Two Decades of Dayboro's Rainfall Extremes
October 10, 2025 | Weather Analysis | 7 min read
As we emerge from a near-average winter and enter what's shaping up to be one of our driest springs on record, it's worth examining how Dayboro's seasonal rainfall patterns have evolved over the past 20 years. The data tells a fascinating story of extremes that have shaped our farming practices, water management, and community resilience.
Winter 2025: A Return to Normal After Years of Extremes
This year's winter brought 105.45 mm of rain to Dayboro—comfortably above our 20-year average but nowhere near the extremes we've witnessed. It's been a welcome reprieve after the rollercoaster of recent years, ranking 14th wettest out of 20 winters on record.
🌧️ The Tale of Two Winters
2008's Freezing Deluge: Our wettest winter ever with 278.6 mm—June alone delivered a staggering 168.2 mm. This was the winter that brought Queensland its only recorded freezing temperature (0.0°C on July 18). It set the stage for what would become the catastrophic 2010-11 floods.
2015's Desert Winter: A mere 21.0 mm for the entire season—with absolutely ZERO rain in June and July. Farmers watched helplessly as dams dried and crops withered during what became part of the broader Queensland drought crisis.
The contrast is stark: 2010 was Queensland's wettest year on record with 1,137mm , while the 2010-11 floods affected at least 90 towns and over 200,000 people across Queensland . Our local data shows how Dayboro's winter of 2010, with 214.7 mm (third wettest), contributed to the saturated conditions that preceded the disaster.
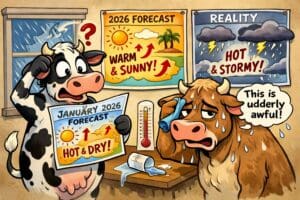
Spring 2025: Breaking Records in the Wrong Direction
If winter was reassuringly average, spring is proving anything but. With only 4.2 mm recorded so far (through October 10), we're on track for potentially the driest spring in our records. To put this in perspective:
- Our average spring rainfall: 235.1 mm
- Wettest spring (2024): 786.8 mm—last year's deluge
- Previous driest complete spring (2006): 50.0 mm
- Current trajectory: Less than 10% of average
The Bigger Picture: Climate Cycles and Local Impact
The Millennium drought from 1997-2010 was considered the worst drought recorded since European settlement , and our data shows how Dayboro wasn't immune. The years 2006, 2012, and 2014 all recorded "Very Dry" springs, with 2014 particularly brutal—zero rainfall in both October and November.
But it's not just about the totals. The 2010-11 floods were triggered by a combination of factors including an unusually strong La Niña event and record-high ocean temperatures . Our spring 2010 data shows 720.8 mm—our second-wettest spring—with October alone delivering 461.6 mm.
Emerging Patterns We're Tracking:
- Volatility Increasing: The gap between wet and dry years is widening
- Winter Reliability: More consistent than spring, averaging 129.5 mm
- Spring Extremes: 7 of our 19 complete springs were either "Very Wet" or "Very Dry"
- Temperature Correlation: Warmer winters often coincide with higher rainfall
What This Means for You
🌱 For Growers and Gardeners
Understanding these patterns is crucial for planning. Our driest winters (like 2015 and 2018) were often followed by volatile springs. Currently, with spring 2025 shaping up as exceptionally dry:
- Irrigation scheduling becomes critical
- Crop selection should favor drought-tolerant varieties
- Soil moisture conservation is paramount
Calculate your exact watering needs with our Water Smart Calculator →
🏠 For Property Owners
Historical extremes inform future preparedness. The 278.6 mm winter of 2008 versus the 21.0 mm winter of 2015 represents a 13-fold difference. Such variability demands:
- Robust water storage solutions
- Drainage systems capable of handling intense rainfall
- Drought contingency planning
Looking Ahead: What History Suggests
While we can't predict exact rainfall amounts, historical patterns offer insights. Major Australian droughts typically occur at intervals of 11 to 14 years . With the Millennium drought ending in 2010 and current dry conditions emerging, we may be entering another significant dry cycle.
🔓 Unlock Comprehensive Weather Intelligence
Get access to our full suite of analytical tools:
- ✓ 20-year detailed rainfall database with daily records
- ✓ Predictive models using Inigo Jones and ensemble forecasting
- ✓ Real-time soil moisture and evapotranspiration tracking
- ✓ Custom alerts for critical weather thresholds
- ✓ Historical comparison tools for any date range
- ✓ Export data for your own analysis
From just $9/month for home gardeners
Start Your Free TrialExplore More Weather Intelligence
📈 Today in Time
See how today compares to the same date in previous years—temperature, rainfall, and growing conditions.
Explore Historical Trends →💧 Water Smart Calculator
Calculate precise irrigation requirements based on current evapotranspiration and rainfall deficit.
Calculate Water Needs →🌡️ Weather Hub
Your complete weather command center—current conditions, forecasts, and analysis tools.
Visit Weather Hub →