
March 2026 Weather Review — Dayboro’s Month of Two Halves | Dayboro Weather

March 2026 split in two: 208mm of rain and 50,000 lightning strikes in the first half, then a dry slide into autumn with Dayboro’s third-coldest March night on record.
Vegetable Price Outlook — April 2026

Vegetable prices across four Brisbane supermarkets are surging. Tomatoes up 26% in a month, lettuce at $16/kg, garlic at $36/kg. Three weather disasters and rising diesel explain why.
CO2 Does Not Drive Global Temperature: What 600 Million Years of Evidence Actually Shows

Six hundred million years of geological evidence — ice cores, ocean sediments, and the landmark 2026 Allan Hills study — shows CO2 and global temperature frequently move in opposite directions.
Dayboro Buddy – App

Dayboro Buddy is a free Android app delivering real-time weather from the Lyndhurst Hill station, seasonal garden insights for Dayboro’s microclimate, and local community events — built for the valley.
Dayboro Creeks flooding.

Live BOM creek level readings for five Dayboro crossings including Kobble Creek, Young’s Crossing, and Lees Crossing, plus a 7-day crossing risk forecast built from historical flood data and the Dayboro Model.
Flood probability march/april 2026

A data-driven flood risk assessment for Dayboro Valley covering March and April 2026, drawing on Stanley River history, current dam levels, La Niña conditions, and the Inigo Jones analytical framework.
Updates March 2026

March 2026 site updates including personalised solar production forecasts, upgraded 30-day climate outlook with live indicators from NOAA and BOM, membership page fixes, and encrypted solar array storage for members.
Tropical Lows March 2026
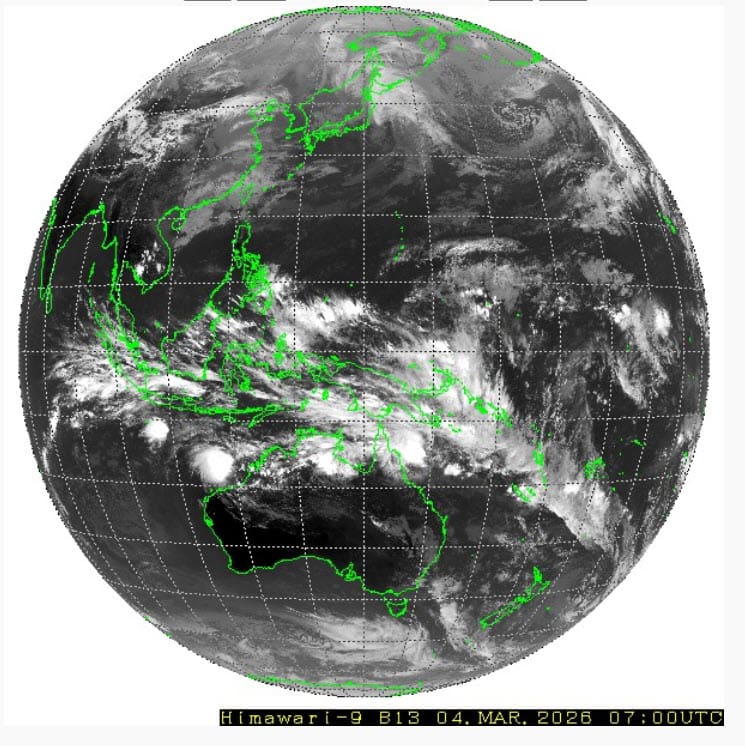
Four tropical lows developed simultaneously across northern Australia on 4 March 2026. A scientific analysis of Tropical Low 29U’s cyclone probability and the realistic threat to Dayboro in the D’Aguilar foothills.
Dayboro Weather Outlook: 2–8 March 2026 — Dry Start, Wet Finish

Split week for Dayboro — clear skies and low 30s Monday to Wednesday, then a trough brings dense cloud and persistent rain from Friday through Sunday. Garden pest alert for slugs and blight.
February 2026 Forecast Accuracy Scorecard: Dayboro Model vs BOM
February 2026 forecast accuracy scorecard comparing the Dayboro Model, BOM, and Inigo Jones against recorded station data. Temperature, rainfall, humidity, and wind results with full metrics tables.